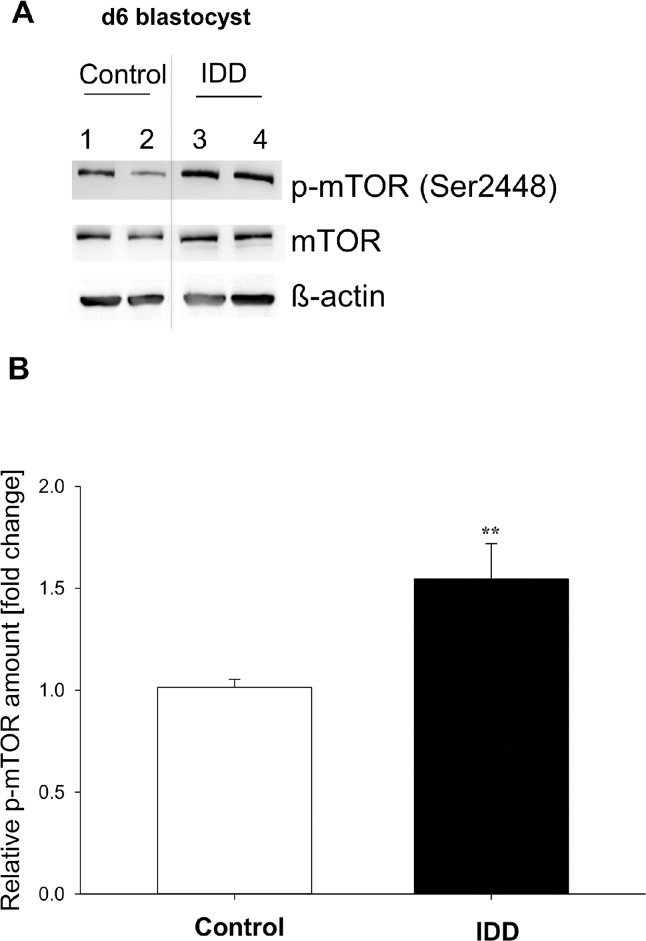
Fig 6. Phosphorylation of mTOR in blastocysts of diabetic (IDD) rabbits.
The relative amount of mTOR phosphorylation was quantified by Western blotting in four samples pooled from a total of 30 blastocysts of gastrulation stage 2. (A) shows a representative Western Blot of two pooled samples (n≥ 7 blastocysts per sample) from blastocysts from control (lanes 1,2) and diabetic (lanes 3,4) rabbits. The amount of phosphorylated protein was related to the non-phosphorylated protein and calculated relative to the healthy blastocysts (set 1). The phosphorylation of mTOR was significantly increased in stage 2 blastocysts of diabetic rabbits compared to controls (B). (N = 4; n = 30; ** = p< 0.005).

