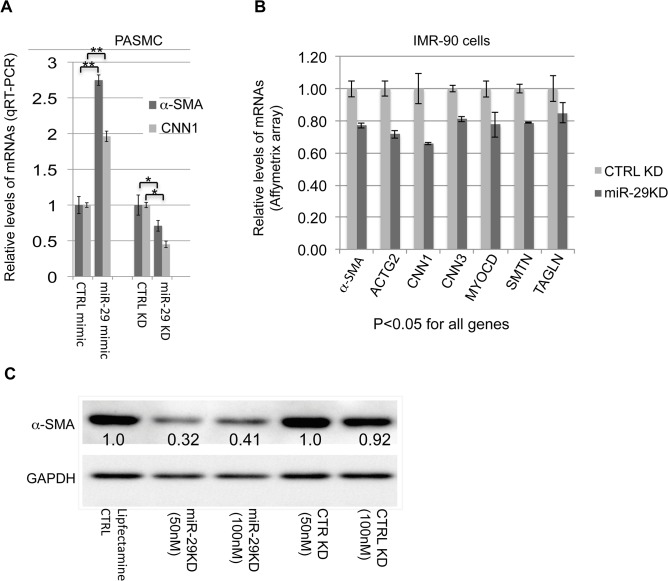
Fig 6. miR-29 promotes the expression of contractile SMC markers.
(A) qRT-PCR results of α-SMA and CNN1 mRNAs in PASMCs in which the level of miR-29 is either elevated by miR-29 mimic or knocked down by miR-29 antisense LNA oligos (n = 3); (B) mRNA levels of contractile SMC markers in IMR-90 cells, in which miR-29 is knocked down (n = 3, Affymetrix array data); (C) Levels of α-SMA protein in IMR-90 cells, in which endogenous miR-29 is knocked down. Densitometric analyses of the blot are presented as relative ratios of α-SMA /GAPDH. Ratio of the control is arbitrarily presented as 1. Fold changes of ratio are indicated beneath the corresponding bands. Data are mean ± SEM; Student’s t test, * P<0.05; ** P<0.01.

