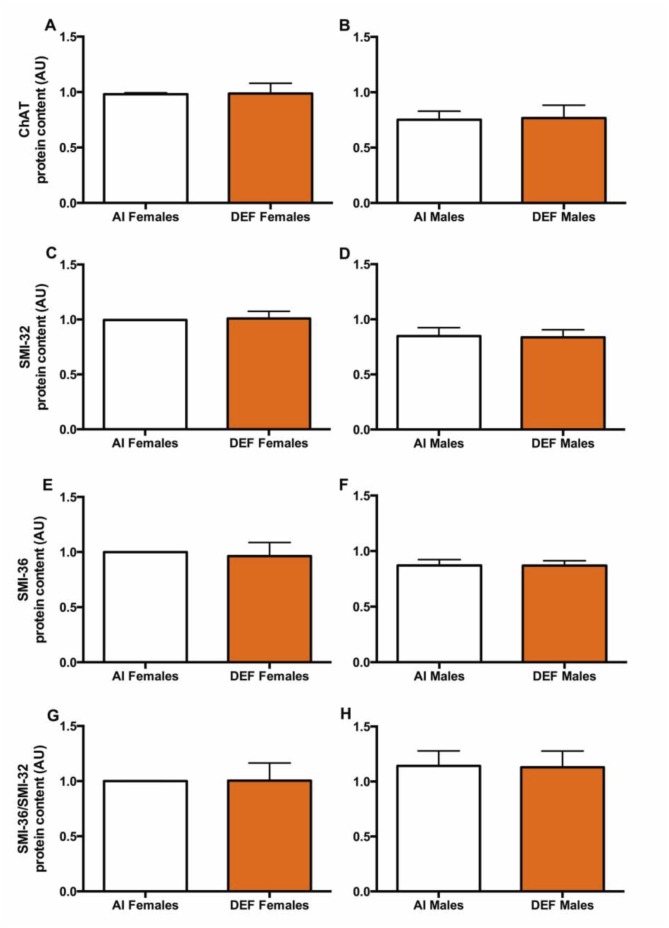
Fig 7. Neuron count in DEF vs. AI G93A mice.
ChAT (A and B), SMI-32 (C and D), SMI-36 (E and F) and SMI-36/SMI-32 ratio (G and H) protein content (arbitrary units; AU) in spinal cord of 42 G93A mice: 23 adequate vitamin D3 intake (AI; 1 IU D3/g feed; 12 M, 11 F) and 19 deficient vitamin D3 intake (DEF; 0.025 IU D3/g feed; 10 M, 9 F). ChAT (A and B): There was no significant difference in ChAT protein content between the diets. AI males had 23% lower ChAT protein content vs. AI females (P = 0.005). DEF males had 22% lower ChAT protein content vs. DEF females (P = 0.082). SMI-32 (C and D): There was no significant difference in SMI-32 protein content between the diets. AI males had 15% lower SMI-32 protein content vs. AI females (P = 0.039). DEF males had 17% lower SMI-32 protein content vs. DEF females (P = 0.046). SMI-36 (E and F): There was no significant difference in SMI-36 protein content between the diets. AI males had 13% lower SMI-36 protein content vs. AI females (P = 0.016). SMI-36/SMI-32 ratio (G and H): There was no significant difference in SMI-36/SMI-32 protein content between the diets or between the sexes. Data presented as means ± SEM.

