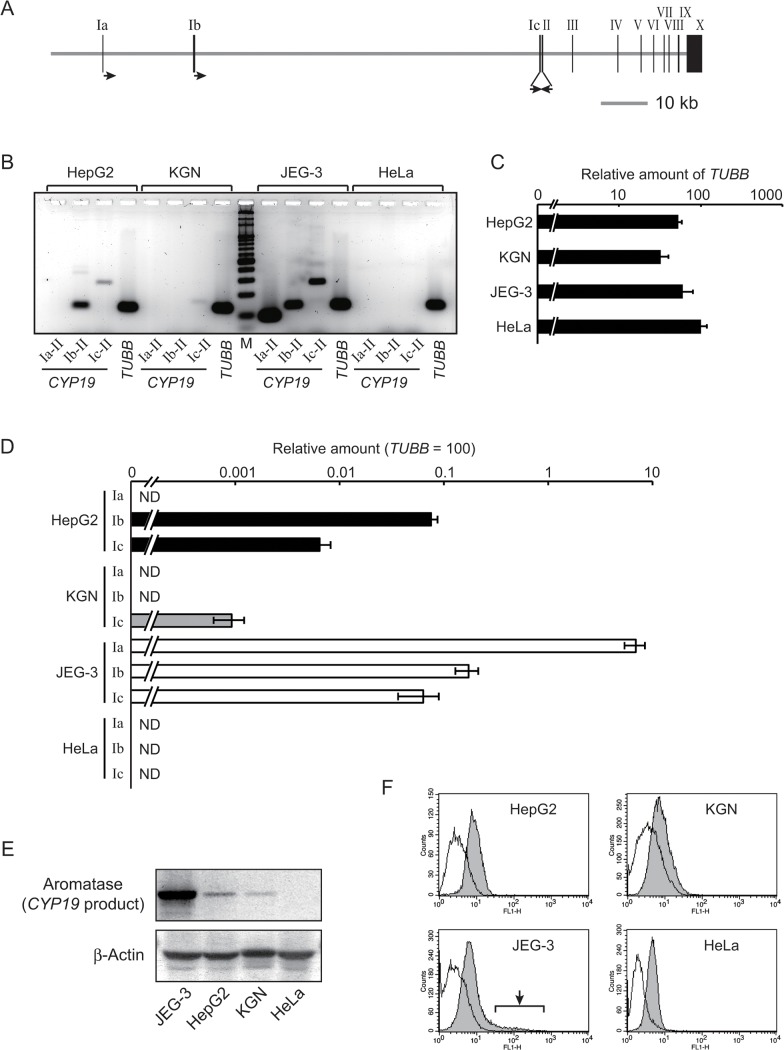
Fig 1. Transcription from each of three CYP19 promoters.
(A) The gene structure of the human CYP19 locus. Closed boxes with Roman numerals represent exons of the gene. Primers for conventional RT-PCR are denoted as arrows; the three rightward arrows are forward primers for the respective first exons, while the leftward arrow is a reverse primer for the common second exon. (B) Conventional RT-PCR analyses revealed the existence of three kinds of CYP19 transcripts. “Ia-II”, “Ib-II”, or “Ic-II” indicates a PCR reaction amplified with a primer set annealing to exons Ia/II, exons Ib/II, or exons Ic/II, respectively. PCR for the “TUBB” (β-tubulin) gene was performed as a control. “M” denotes a molecular weight marker. (C) Quantitative RT-PCR analyses revealed a comparable level of the TUBB transcripts among HepG2, KGN, and JEG-3 cell lines following normalization to the amount of 18S rRNA. The quantitative similarity was confirmed after performing Student’s t-test (p > 0.05). The value for the transcripts in the three cell lines is presented as a percentage of that in HeLa cells. (D) The relative amount of each kind of the CYP19 transcript was estimated by using quantitative RT-PCR (see Materials and Methods). “Ia”, “Ib”, or “Ic” indicates a PCR reaction for transcripts initiated from the exon Ia, Ib, or Ic, respectively. The values in the chart denote a percentage of the amount of the TUBB transcripts in each cell line. “ND” means “not detected”. (E) The amount of aromatase, which is the product of the CYP19 gene, was estimated using western blotting analyses. As a loading control, blotting with anti-β-actin was also performed. (F) By using flow cytometry analyses, the homogeneity of the expression of the CYP19 gene in each cell line was analyzed. Only in JEG-3 cells, a cell population extra-highly expressing the CYP19 gene was detected (arrow in the panel of JEG-3). The open or the filled gray histogram denotes cell populations stained with mouse IgG isotype control or anti-aromatase antibody, respectively.

