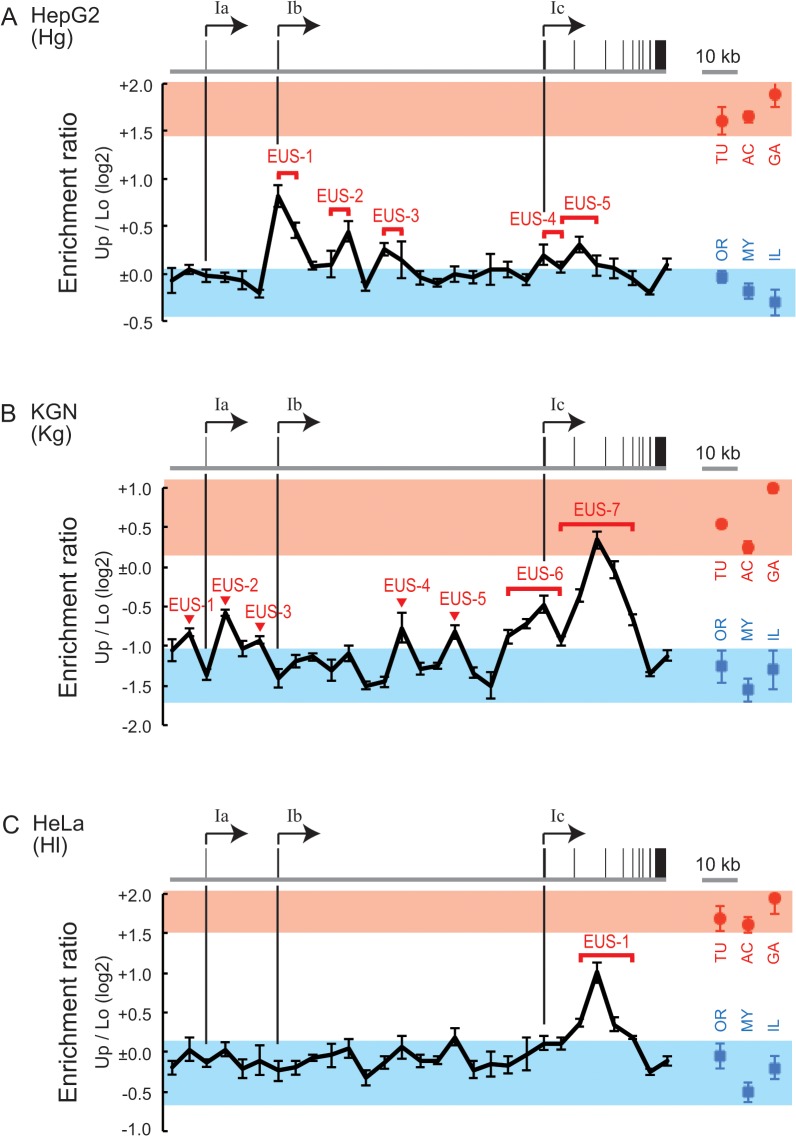
Fig 3. Chromatin structure observed in the SEVENS assay.
(A-C) The SEVENS assays revealed distinct chromatin structures in the CYP19 locus of HepG2 (A), KGN (B), and HeLa cells (C). The proportion of open and closed chromatin is represented as an enrichment ratio of a given sequence in upper fractions to that in lower fractions (Up/Lo) using a log2 scale (see Materials and Methods). The gene structure of the CYP19 locus is drawn above each chart. Each vertical line extends from a promoter region to note a corresponding position in the respective lower charts. Red circles and blue rectangles denote the Up/Lo values of active and repressed reference loci, respectively, which are abbreviated as TU, AC, GA, OR, MY, or IL for the TUBB, ACTB, GAPDH, OR1A1, MYT1, or IL2RA loci, respectively. To compare assessed regions of the CYP19 locus to these references, red and blue belts are placed on the charts to indicate the ranges of the Up/Lo values of the references. The positions referred to in the text are labeled as “enrichment in upper fractions of the SEVENS assay (EUS)” in the charts.

