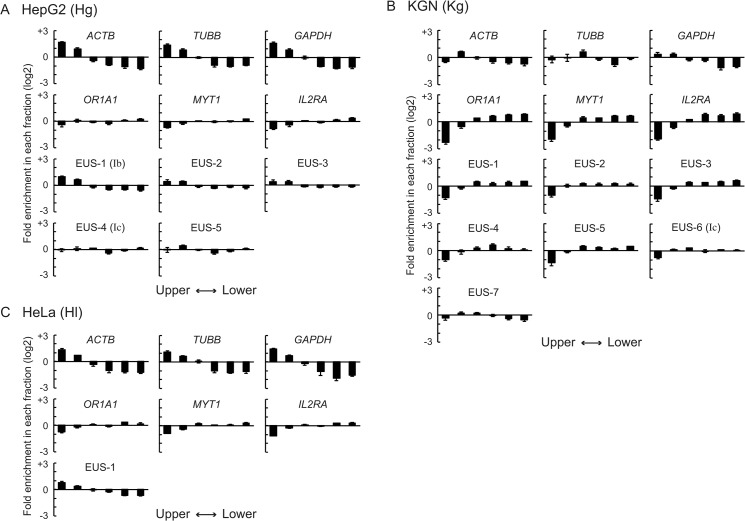
Fig 4. The enrichment of the reference loci and the EUS regions of the CYP19 locus in individual SEVENS fractions.
(A-C) The fractional distribution of the active reference loci (panels in the first row), the repressed reference loci (panels in the second row), and the EUS regions (panels in the third to fifth rows) in HepG2 (A), KGN (B), or HeLa cells (C) was represented as the fold enrichment in each fraction relative to an average calculated from total fractions by using a log2 scale.

