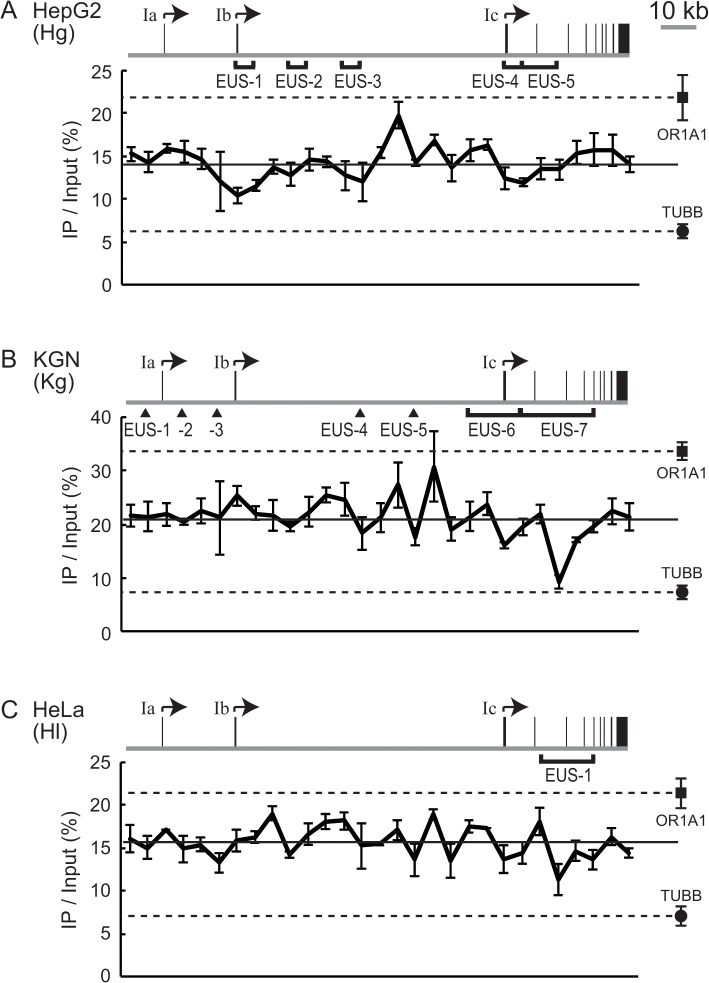
Fig 5. The nucleosome occupancy in the CYP19 locus.
(A-C) ChIP assays with anti-pan-histone H3 revealed the amount of nucleosomes in the CYP19 locus in HepG2 (A), KGN (B), or HeLa cells (C). The nucleosome level is expressed as a percentage of total input chromatin (IP/Input). The solid line in the respective charts represents the average value of IP/Input. The level at the OR1A1 (■) or the TUBB (●) locus as a reference is also plotted at the right of each chart. To compare a given region in the CYP19 locus to the references, broken lines are drawn from the reference marks. The gene structure of CYP19 and the EUS regions are also represented on each chart.

