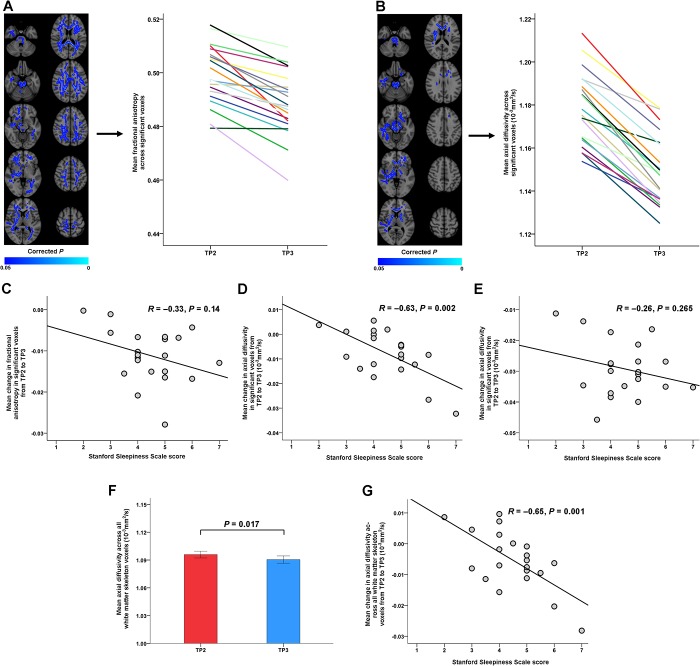
Fig 2. Changes in diffusion tensor imaging (DTI) indices of white matter microstructure after sleep deprivation and associations with sleepiness.
(A) Significant decreases in fractional anisotropy (FA) after sleep deprivation (blue colors; left panel). (B) Significant decreases in axial diffusivity (AD) after sleep deprivation (blue colors; left panel). Averaged DTI values at time point (TP)2 and TP3 across significant voxels are shown for each participant using individual colors in the right panels of (A) and (B). Values from the same participant are connected with a line. (C) No significant relationship was observed between the decrease in FA in the voxels shown in (A) and Stanford Sleepiness Scale (SSS) score at TP3 (R = −0.33, P = 0.14). (D) Because the FA decreases in the significant voxels of (A) were mainly driven by AD reductions, we examined whether reductions in averaged AD within these clusters correlated with SSS score and found a significant negative association (R = −0.63, P = 0.002), indicating greater sleepiness in subjects with larger AD reductions after sleep deprivation. (E) No significant relationship was found between AD reductions across the voxels shown in (B) and SSS score (R = −0.26, P = 0.265). (F,G) Averaged AD across all voxels of the white matter skeleton decreased significantly from TP2 to TP3; this decrease was significantly correlated with sleepiness at TP3 (R = −0.65, P = 0.001). The left side of the brain images represents the right hemisphere.

