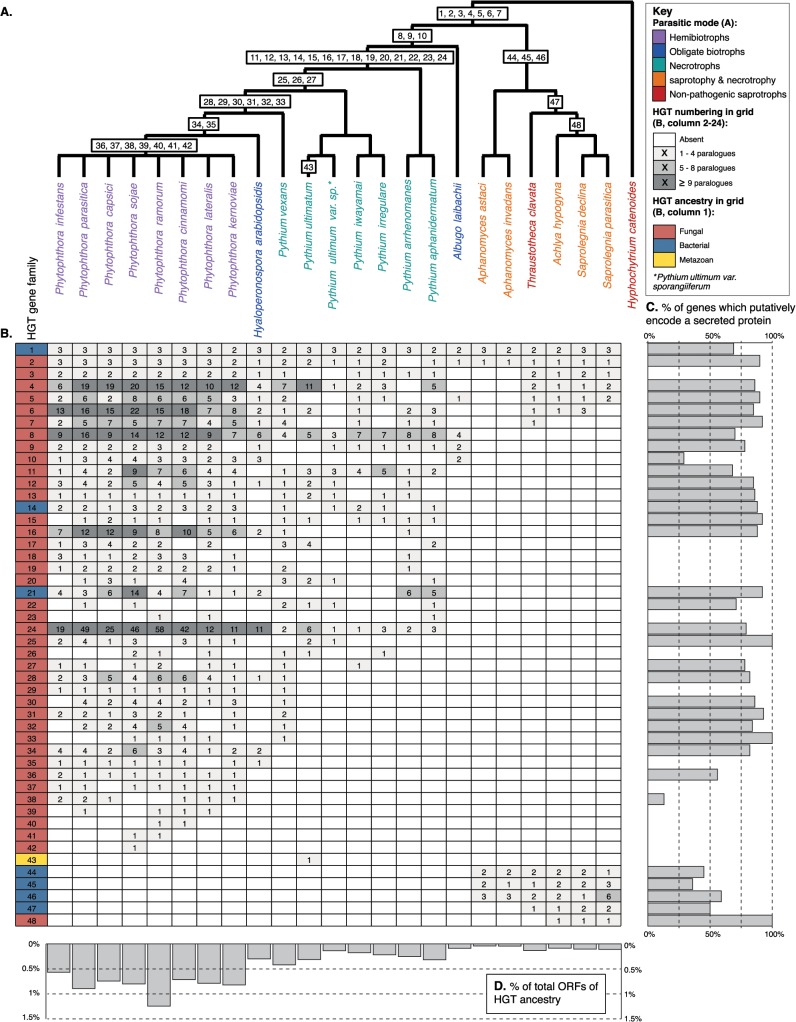
Fig 1. (A) Schematic representation of the phylogeny of the oomycetes with Hyphochytrium catenoides as an outgroup.
The likely point of acquisition given current genome sampling of each individual HGT is labelled 1–48. See S1 Table for source information and standard of support for each HGT (i.e., phylogeny showing putative HGT gene nested within donor clade or patchy taxonomic distribution of gene family). (B) Grid summarising the distribution of 48 HGT gene families and the extent of gene duplication (number of paralogues) for 23 oomycetes. (C) The percentage of total gene copies predicted to encode secreted proteins for each HGT family. (D) The percentage of total Open Reading Frames (ORFs) from an oomycete genome that have been identified as derived by HGT ancestry.

