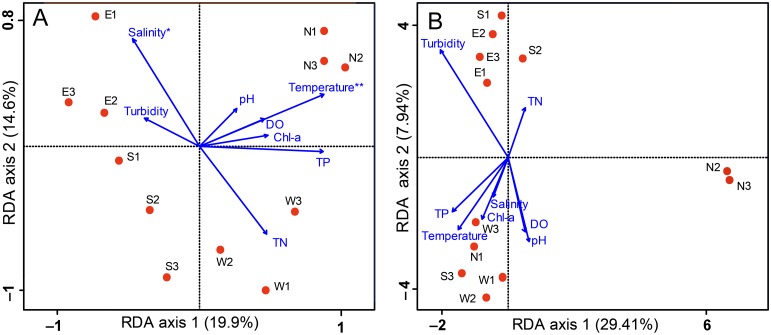
Fig 5. RDA ordination showing the microeukaryotic community composition in relation to the environmental variables.
The community composition was based on DGGE (A) and Miseq sequencing (B), respectively. Sampling sites are displayed by circles, environmental variables are shown by arrows. Statistically significant environmental variables are marked with an asterisk (P < 0.1) and two asterisks (P < 0.05) according to Monte Carlo permutation test.

