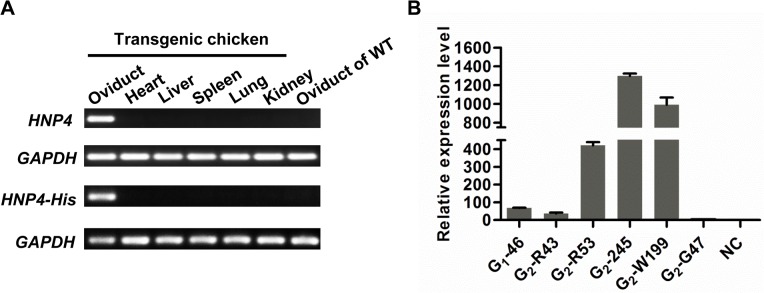
Fig 4. Expression of HNP4 and HNP4-His genes in transgenic chickens.

A. RT-PCR analysis of the expression of the HNP4 and HNP4-His genes in the transgenic hens (G1-46 with HNP4 and G1-7 with HNP4-His). Lanes 1–6 represent the oviduct, heart, liver, spleen, lung, and kidney tissues from the transgenic hen (G1), respectively. Lane 7 represents the oviduct tissue from the nontransgenic hens. B. qRT-PCR was used to quantify the transgene in the G1 and G2 hens with different insertion sites. Column 1 represents the oviduct of G1 hen G1-46; columns 2–6 represent the oviducts of G2 hens G2-R43, G2-R53, G2-245, G2-W199, and G2-G47, respectively; and NC represents the oviduct of a nontransgenic hen.
