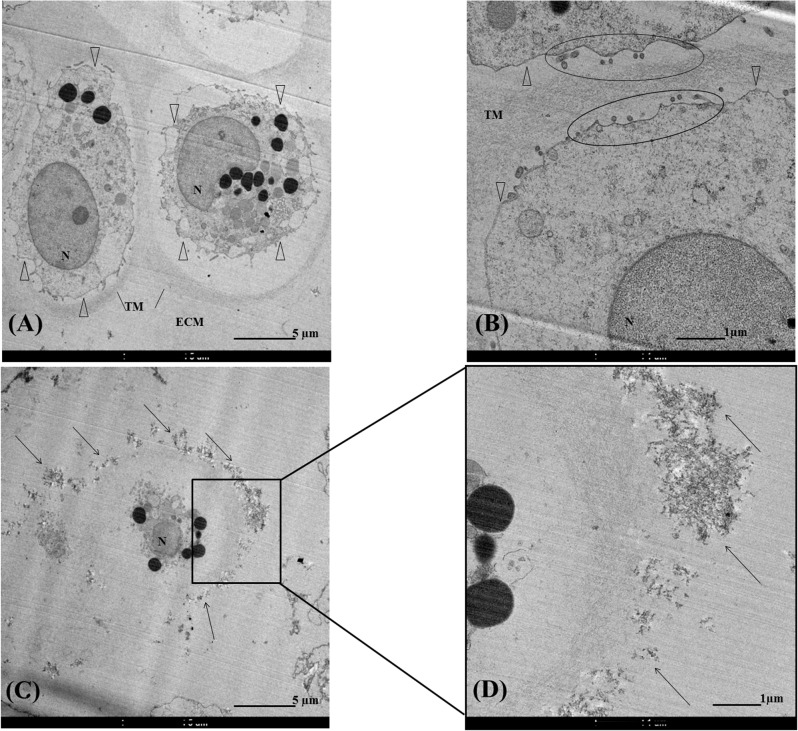
Fig 2. Transmission electron microscopy of chondrocytes in chitosan-alginate beads sections.
Transmission electron micrograph of chondrocytes (A-D). N = nucleus. Δ represented pericellular matrix. TM = territorial matrix. ECM = extracellular matrix. Areas surrounded in (B) presented matrix‘s microvillus. Arrow in (C-D) represented flaky accumulation around chondrocyte.

