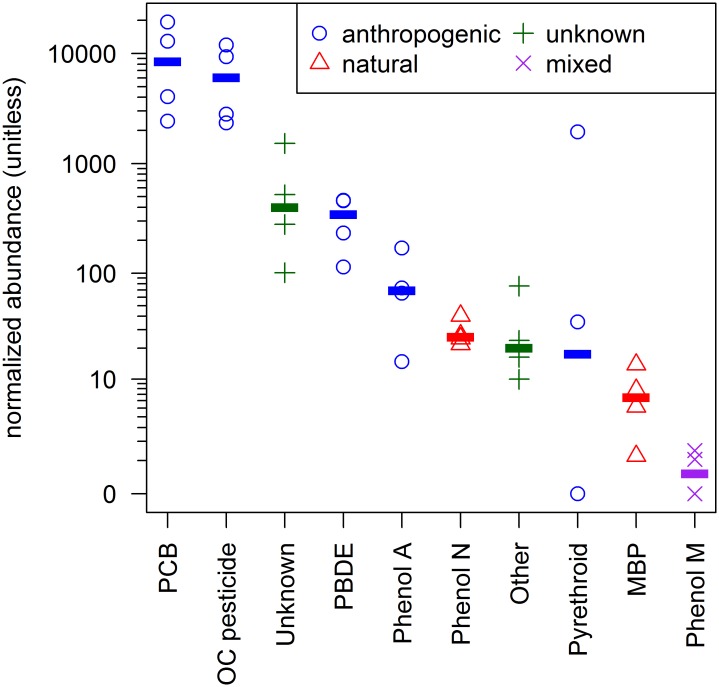
Fig 1. Relative Abundance of Compound Classes.
Each point represents detection in a single egg sample (n = 4). The abundance is the sum total of the normalized peak areas for all compounds in the class, in each sample. The line is the median abundance for the compound class. The source of each compound class is indicated in the legend. Non-detects are shown with a value of zero (multiple non-detects overlap).

