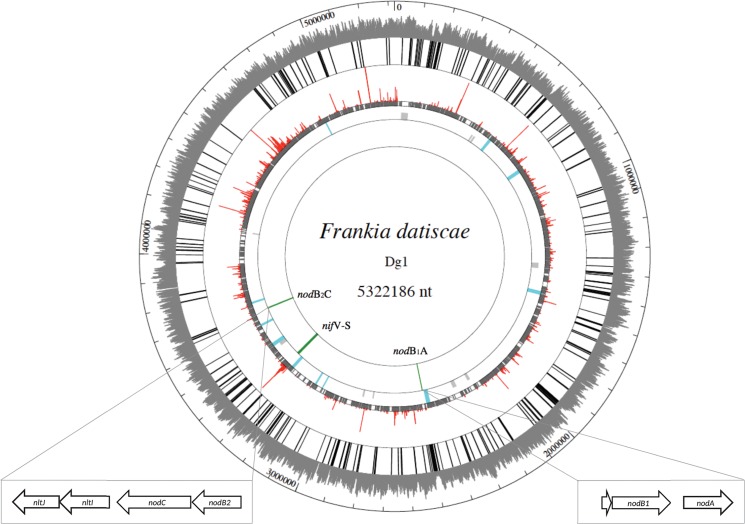
Fig 1. Circular map of the Dg1 genome.
The outer circle shows the GC content (above 50%), the next circle shows the positions of IS elements (for detailed positions, see S2 Table). The next circle shows the results of mapping the transcriptome of a closely related cluster II strain on the Dg1 genome: the red peaks represent the genes expressed in the top 5% of expression levels, the grey peaks represent genes represented by at least one read per kb. The next circle shows the operons of genes encoding enzymes involved in the biosynthesis of secondary metabolites (S4 Table): blue color denotes genes which are represented in the symbiotic transcriptome, grey color operons that are not. The last circle shows the positions of the two operons of canonical nod genes (nodA’B1A and nodB2C) and the nif gene operon. The nod operons of Dg1 are depicted in detail. The nodA’B1A operon is at position 2,490,158–2,489,200 of the genome, the nodB2C operon at position 3,662,361–3,664,562. The latter is followed by the nltIJ genes at position 3,664,716–3,666,622.

