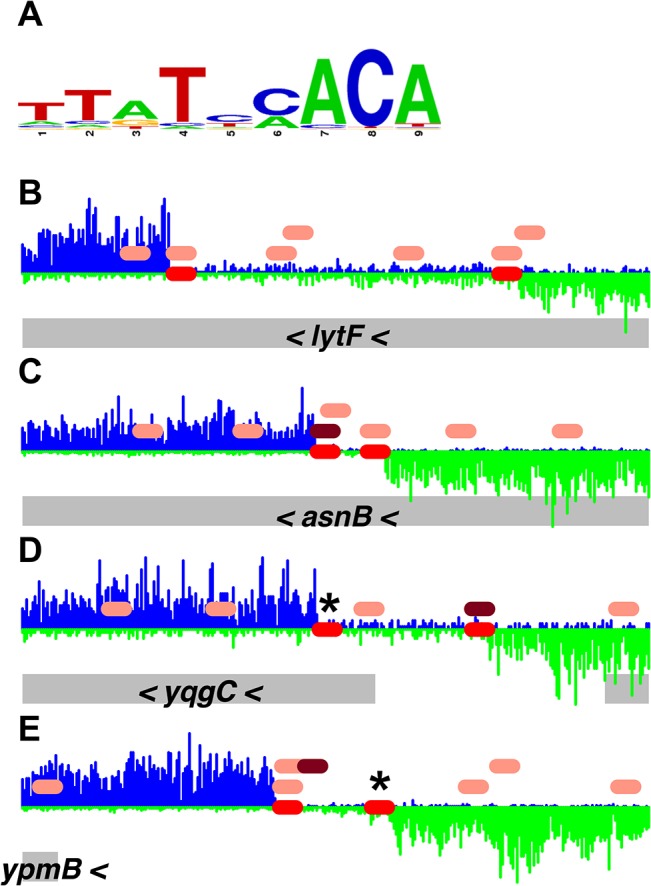
Fig 4. Comparison of DnaA boxes from a consensus sequence with DnaA boxes from the PSSM.

(A) A logo, drawn using WebLogo [32], of the DnaA boxes used to construct the DnaA box PSSM is shown. (B-E) Histograms of the number of sequence reads that start at each nucleotide are plotted (blue for sequence reads mapping to the top strand; green for sequence reads mapping to the bottom strand). Data are from the binding reaction containing 4.1 μM ATP-DnaA-his. For each panel, a 300 bp portion of the genome is presented, and the y-axes are scaled so that the data fills the space. The red ovals on the horizontal axis indicate the position of DnaA binding sites predicted using the PSSM described here. The pink ovals above the horizontal axis indicate DnaA boxes with 2 mismatches from the TTATNCACA consensus sequence, and the maroon ovals have 1 mismatch from the TTATNCACA consensus. (No perfect matches to the consensus are found in these regions.) The gray rectangles below the histograms indicate nearby genes, with arrowheads indicating the direction of transcription.
