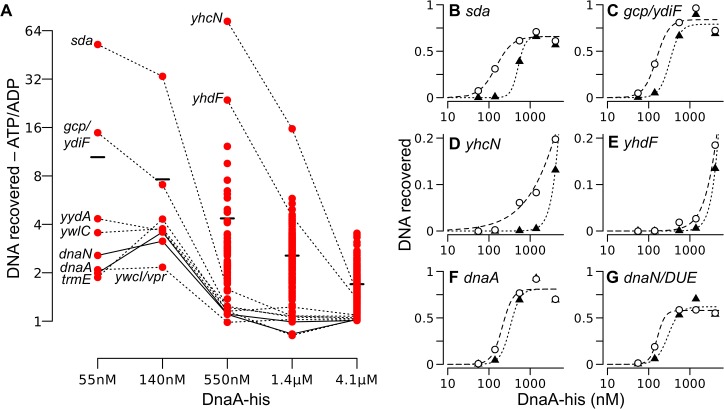
Fig 6. Relative DNA binding by ATP-DnaA-his compared to ADP-DnaA-his.
(A) The ratio of the amount of DNA recovered bound to ATP-DnaA-his vs. ADP-DnaA-his is plotted versus the DnaA concentration. Background binding was subtracted prior to calculating the ratio. All 269 peaks detected at 1.4 μM were analyzed at each concentration, but the ratio of ATP/ADP binding is shown only if the binding was 1.5-times greater than background for both the ATP and the ADP binding reactions at that DnaA-his concentration. For many weaker peaks, these criteria were met only at the highest concentration of DnaA-his. Solid and dotted lines connect points for the indicated region across concentrations. The black bars indicate the average ratio (ATP-DnaA-his/ADP-DnaA-his) at each DnaA-his concentration. The two data points at 1.4 μM DnaA-his that are slightly less than 1 correspond to the yydA and dnaN regions. (B-G) The relative amount of DNA recovered from different chromosomal regions is plotted on the y-axis, versus the DnaA-his concentration (log scale) on the x-axis. ATP-DnaA-his, open circles and dashed lines (data are the same as shown in parts of Fig 5); ADP-DnaA-his, filled triangles and dotted lines. Genomic coordinates (AG1839 genome), and nearby genes: (B) 2620051, upstream of sda and yqeG; (C) 627955, downstream of gcp and ydiF; (D) 972751, inside yhcN; (E) 1006129, inside yhdF; (F) 150, oriC upstream of dnaA; (G) 1841, oriC upstream of the DUE and dnaN.

