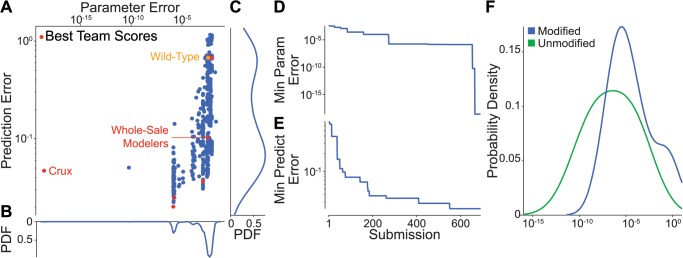
Fig 1. Overview of participant performance.

Nine actively competing teams submitted 691 submissions, including 682 submissions from the five most active and top performing teams. A: Submission error distribution. Red indicates the top scoring submissions for each of the nine active teams. For comparison, orange indicates the parameter and prediction errors of the wild-type parameter values. Overall, the parameter and prediction errors are moderately correlated (log-log R 2 = 0.57). However, the errors are not correlated among the top scoring solutions of the five most active and best performing (log-log R 2 = 0.04). B, C: Marginal parameter and prediction error distributions. D, E: Progression of the minimum parameter and prediction errors across all teams during the challenge. Errors highlight steady participant improvement throughout the 15 week challenge. F: Error distribution of the 30 individual unknown parameters. Errors are averaged across the top 50 scoring solutions from all participants. Blue indicates the 15 modified parameters; green indicates the 15 unknown and unmodified parameters. The comparatively smaller errors for the unmodified parameters indicate that the participants correctly identified which parameters were modified. The overall small errors indicate that the participants ultimately identified the modified parameter values. However, not all parameters were equally well estimated.
