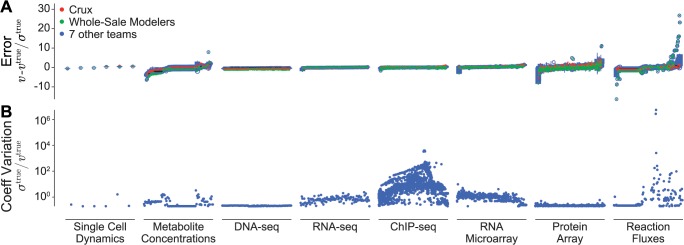
Fig 3. Individual phenotype prediction performance.

A: Prediction performance of the top scoring solutions for the eight in silico data sets. Red and green circles indicate Team Crux’s and Team Whole-Sale Modelers’ highest scoring solutions, respectively. Blue circles indicate the highest scoring solutions of the seven other teams. B: Coefficients of variation of the eight in silico data sets across the life cycles of 32 mutant strain cells. This figure indicates that the reaction flux and ChIP-seq measurements are the most variable, meaning that individual in silico cells with identical parameter values stochastically exhibit significantly different metabolic reaction fluxes and protein-DNA binding patterns. This suggests that these measurements might be the most difficult to reproduce and the least informative for parameter identification.
