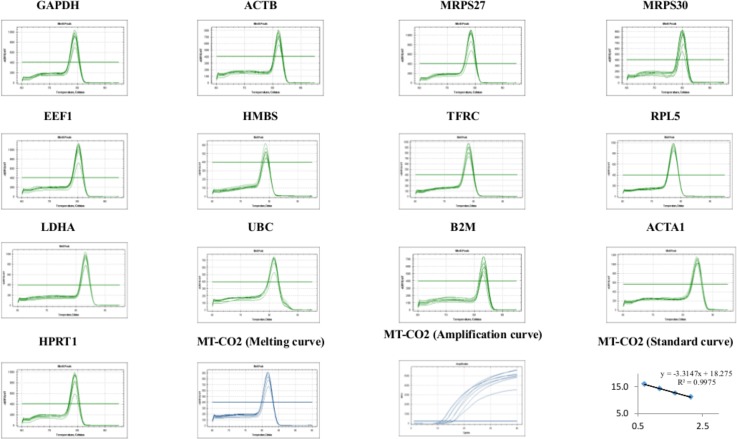
Fig 1. Specificity of RT-qPCR amplification.
Melting curves (dissociation curves) of the 13 reference genes amplicons after the RT-qPCR reactions, all showing one peak. Melting, amplification and standard curves for mitochondrially encoded cytochrome c oxidase II (MT-CO2) target gene are also showed.

