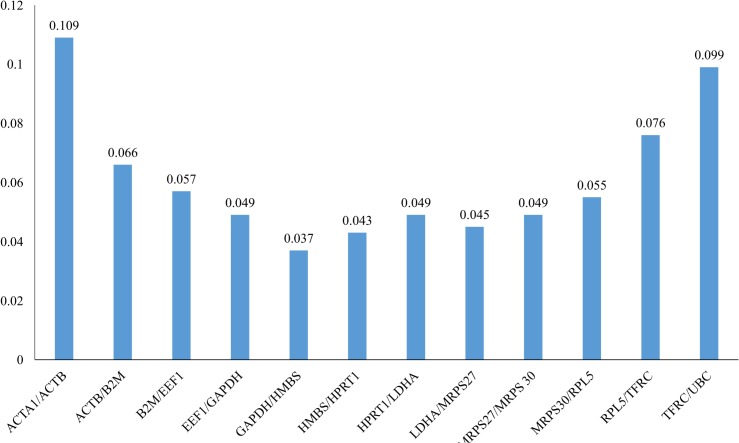
Fig 3. Determination of the Optimal Number of Control Genes for Normalization.
This graph show the geNorm Excel pairwise variation (V) analysis. These values were used to determine optimal number of reference genes based on V-value for normalization in RT-qPCR reaction. Each bar represents change in normalization accuracy when stepwise adding more reference gene.

