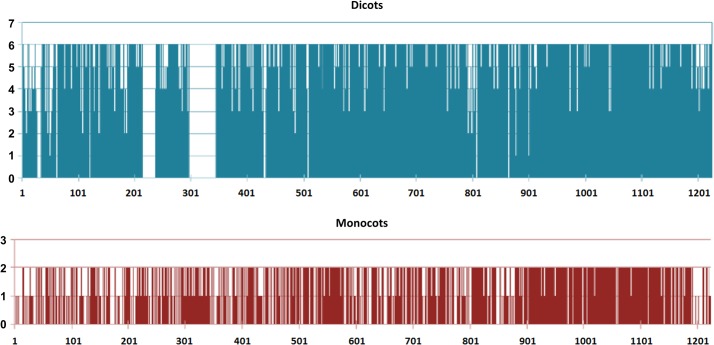
Fig 3. Conservation of amino acid residues of BRI1 proteins in monocots (blue) and dicots (red).
Conservation is represented in the form of bars showing a 0 to 6 level of conservation in monocots or 0 to 2 level of conservation in dicots for each residue. Regions found only in the dicot sequences are represented with a score of 0 in the monocot conservation graph and vice versa.

