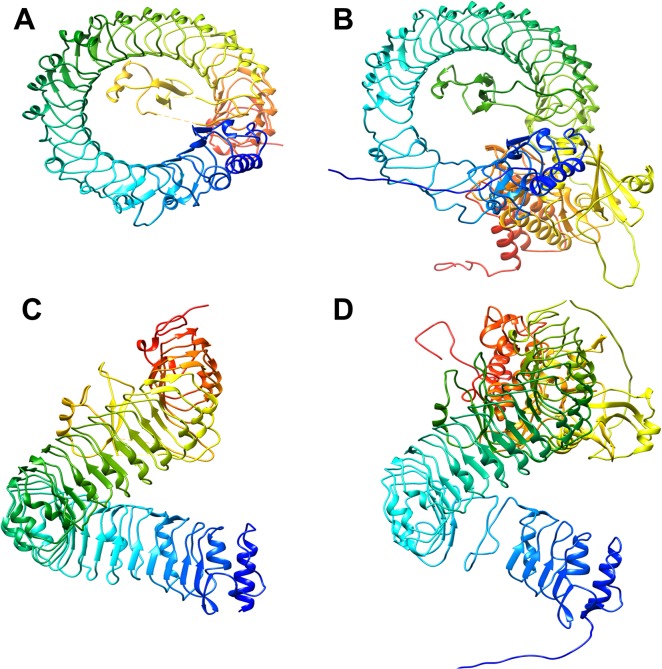
Fig 7. Comparison of predicted 3D structures of AtBRI1 and TaBRI1 proteins.
A, B: AtBRI1 protein; C, D: TaBRI1 protein. A conserved LRR can be observed in the large helical structure shown in blue and green. Yellow and red colors likely represent the KD, with the red region representing the substrate binding site.

