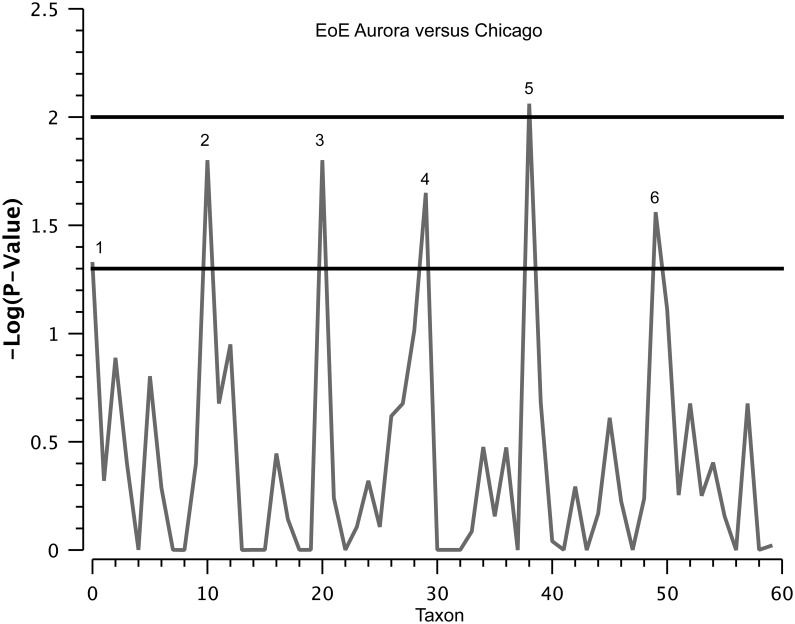
Fig 6. Manhattan plot of the two part statistical analysis of Aurora, CO (n = 17) versus Chicago, IL (n = 20) microbiome samples.
The plot shows the negative log10 p-value for each taxon identified. There are six significant taxa identified. The peaks correspond to 1. Actinomyces (p = 0.048), 2. Prevotella (p = 0.016), 3. Streptococcus (p = 0.016), 4. Parvimonas (p = 0.022), 5. Fusobacterium (p = 0.009) and 6. Aggregatibacter (p = 0.027). All significantly different taxa were elevated in the Aurora relative to Chicago group except for Streptococcus.

