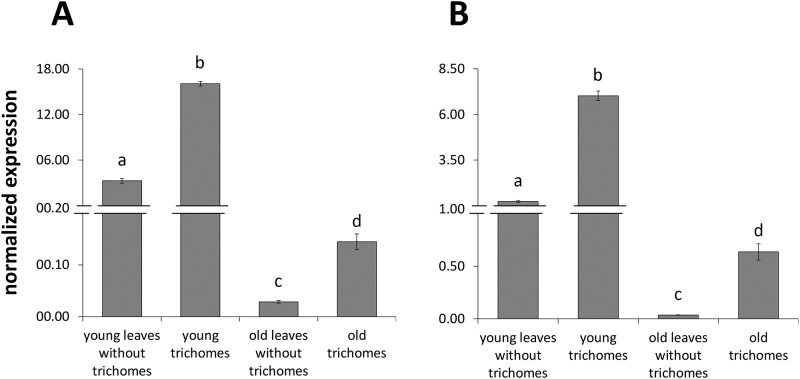
Fig 4. Quantitative expression analysis (qPCR) of SfCPS (A) and SfKSL (B) in trichomes and leaves without trichomes of young and old leaves.
Data bars represent the mean expression levels from three biological replicates ± SE. For each gene, values marked with a different letter are significantly different at p < 0.05, according to Student’s t-test. Transcript levels were normalized to elf4a gene (endogenous control).

