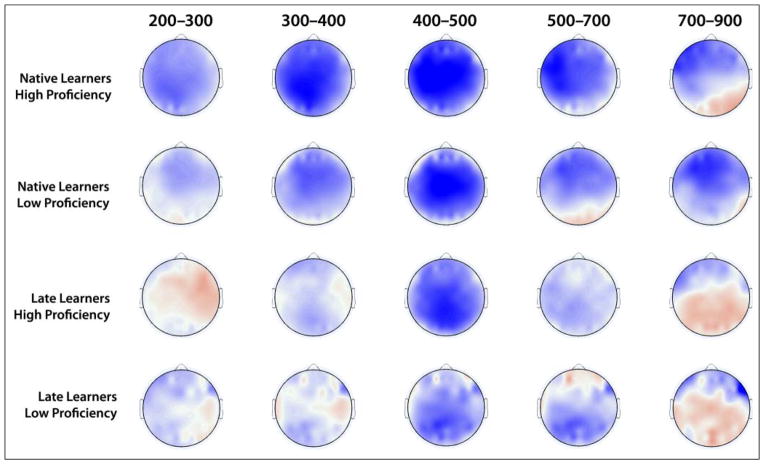
Figure 3.
Scalp voltage maps showing the difference between violation and control words, averaged over selected time windows. Scale is −3 μV (blue) to +3 μV (red). Participants were split into “high”- and “low”-proficiency subgroups based on a median split of composite TOAL-3 scores within each group. Although in the statistical analyses proficiency was treated as a continuous variable rather than dichotomized, here the dichotomization serves to highlight differences that are consistent within each learner group, across variation in proficiency.

