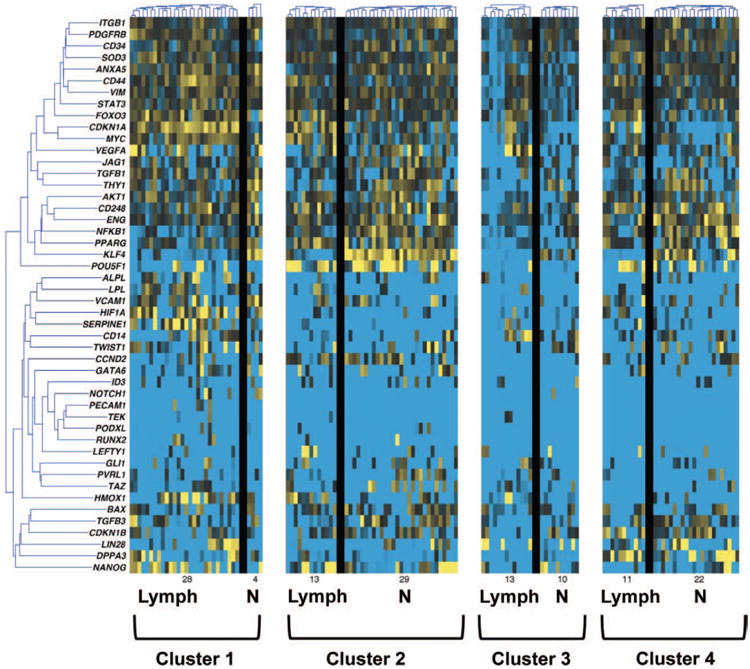
Fig. 2.

Microfluidic-based single-cell transcriptional analysis of human adipose-derived stem cells. Comparison of single-cell gene expression within human adipose-derived stem cells isolated from lymphedema-associated (Lymph) and nonaffected (N) (control) tissue. Genes are organized into rows and cells are represented in columns. Gene expression levels are shown in a color spectrum with high (yellow) and low (blue) expression. Using an information theory–based algorithm, individual cells were assigned into four distinct clusters based on common gene expression patterns. Considerable transcriptional heterogeneity is evident, and differences in cluster membership suggest meaningful differences in adipose-derived stem cell transcriptional programs.
