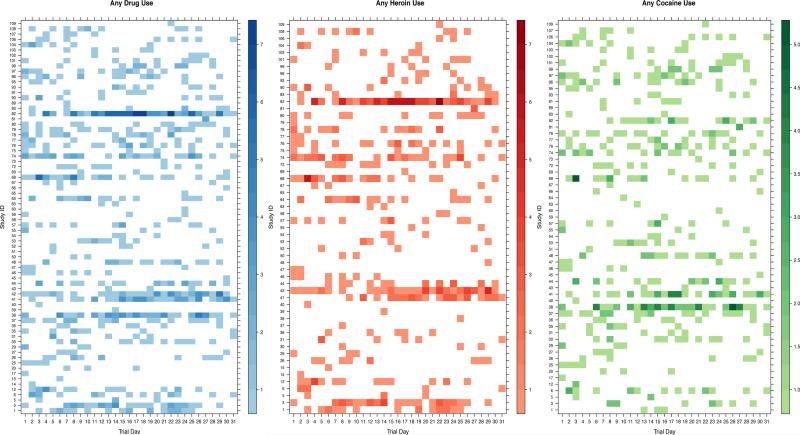
Figure 1. Lattice plots of drug use intensity by day and drug type.
Panel A: Any heroin or cocaine use intensity by trial day. B. Any heroin use intensity by trial day. C. Any cocaine use intensity by trial day. Individuals are represented on the y-axis and the intensity of the color indicates the intensity of self-reported drug use for any given day (darker colors represent more reports of drug use).

