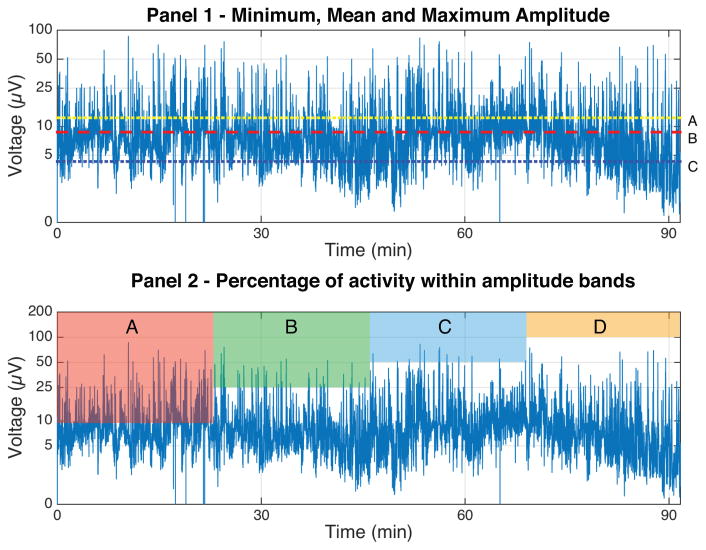
Figure 1.
The top panel depicts a 90-minute aEEG recording. Line A represents the median maximum value (12.3 μV), line B the mean value (8.8 μV) and line C the median minimum value (4.3 μV). The bottom panel depicts the 4 amplitude bands that were assessed in order to determine the content of the trace. Band A represents the percentage of 2 second epochs with a mean value greater than 10 μV, Band B represents those with a mean value greater than 25 μV, Band C represents those with a mean value greater than 50 μV and Band D those greater than 100 μV.

