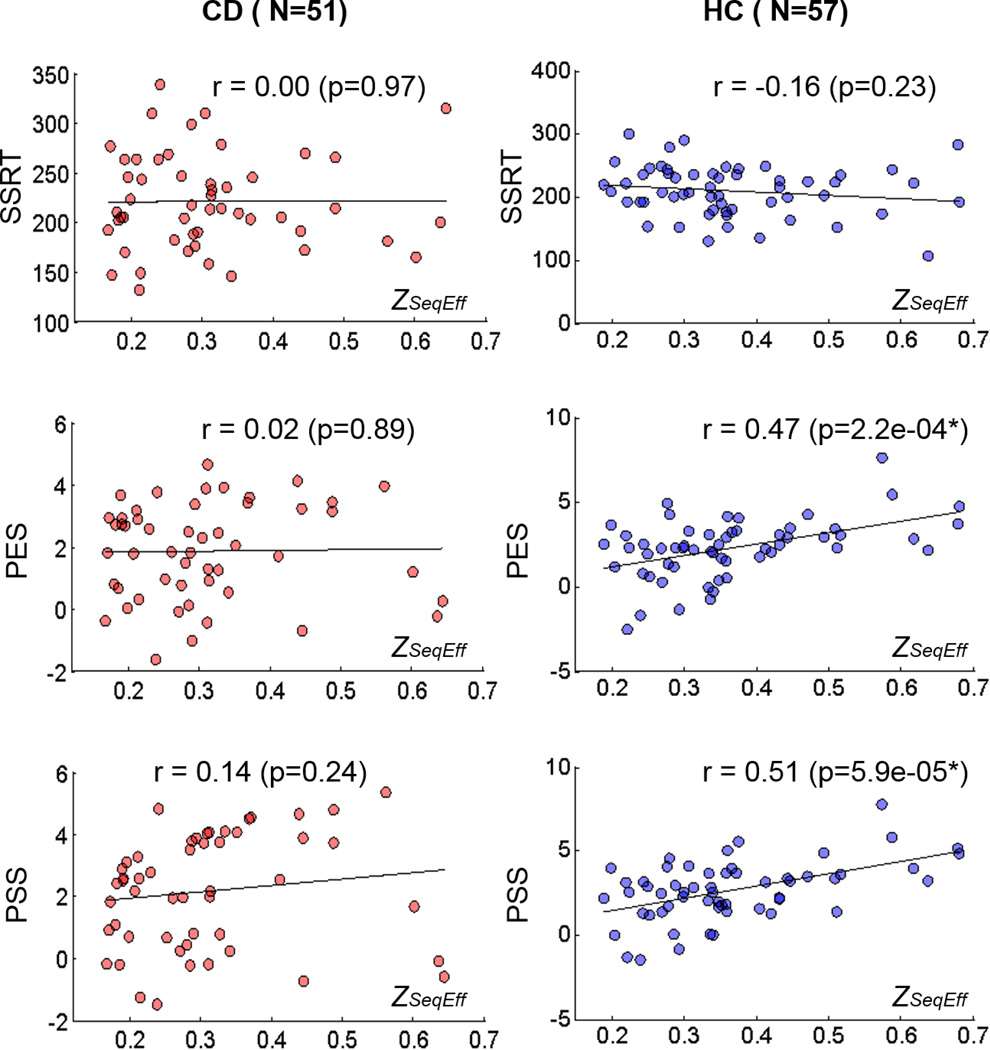
Figure 3.
Stop signal task performance measures and sequential effect, as measured by ZSeqEff. Left column: cocaine dependent (CD) group (n=51). Right column: healthy control (HC) group (n=57). SSRT: stop signal reaction time, PES: post error slowing, PSS: post-stop slowing. * PES and PSS are significantly correlated with ZSeqEff in HC (p<0.05/6, Bonferroni corrected). The regression slopes of ZSeqEff and PES were significantly different between HC and CD participants (T(104)=2.26, p=0.026, two-tailed Student t test). The regression slopes of ZSeqEff and PSS were also significantly different between the two groups (T(104)=2.09, p=0.039, two-tailed Student t test).

