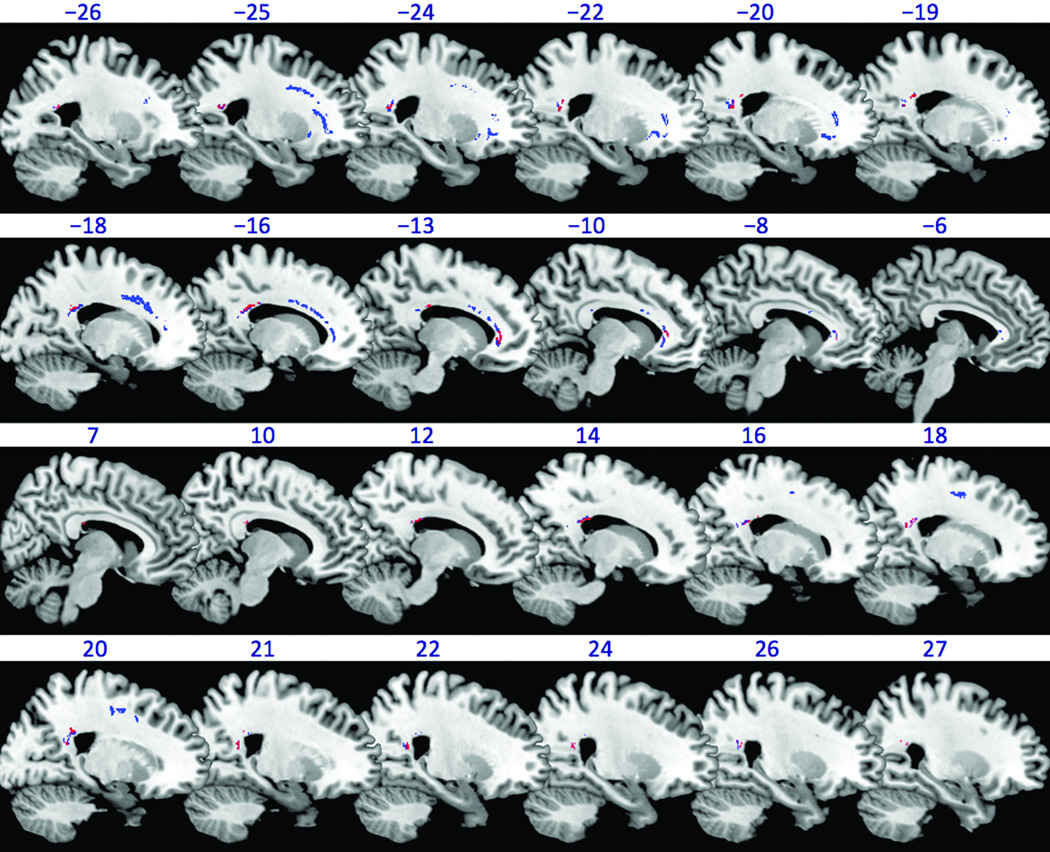
Figure 1.

White matter brain regions showing significant (1-tail, FWE corrected P<0.025) group difference in FA as revealed by the TBSS randomise analysis. The white matter regions in which the COCTBI group had significantly lower (1-tail, FWE corrected P<0.025) FA than the CTL group is shown in red color (without controlling the education) or blue color (controlling the education). The background is an MNI brain template image which is available in the MRIcron software (http://www.mccauslandcenter.sc.edu/mricro/mricron/). The number above each slice indicates slice location (mm) of the MNI y coordinate. Negative (positive) y indicates left (right) hand side of brain.
