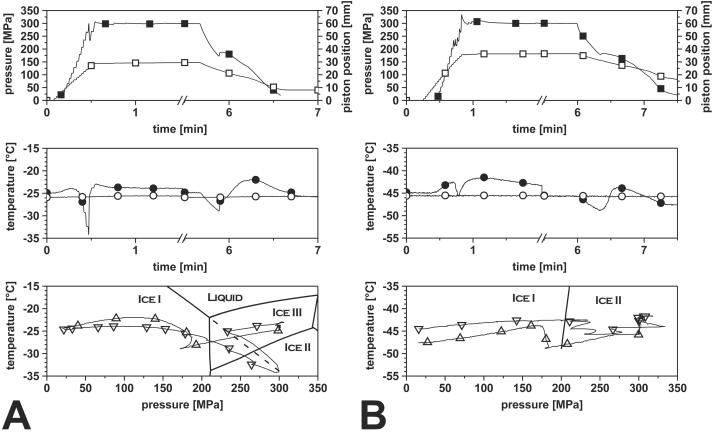
FIG. 2.
Transient solid-to-solid phase transition of PBS inoculated with L. innocua at −25°C (A) and −45°C (B) during pressurization to 300 MPa for 5 min. ▪, pressure; □, piston position; •, sample core temperature; ○, cryostat temperature; ▿, sample core temperature during compression in pT plot; ▵, sample core temperature during decompression in pT plot. The pT plot, the plot of temperature versus pressure, was obtained by plotting the sample core temperature versus the respective system pressure, which visualizes the pressure and temperature combinations during the experiment in relation to the phase transition lines of water. At −25°C, the phase transition from ice I to ice III is accompanied by (partial) thawing, as indicated by the decreasing temperature when approaching the prolonged phase transition line of ice I to liquid (dashed line). At −45°C, thawing of ice I by pressurization is impossible and the direct transition to ice II or ice III occurs.

