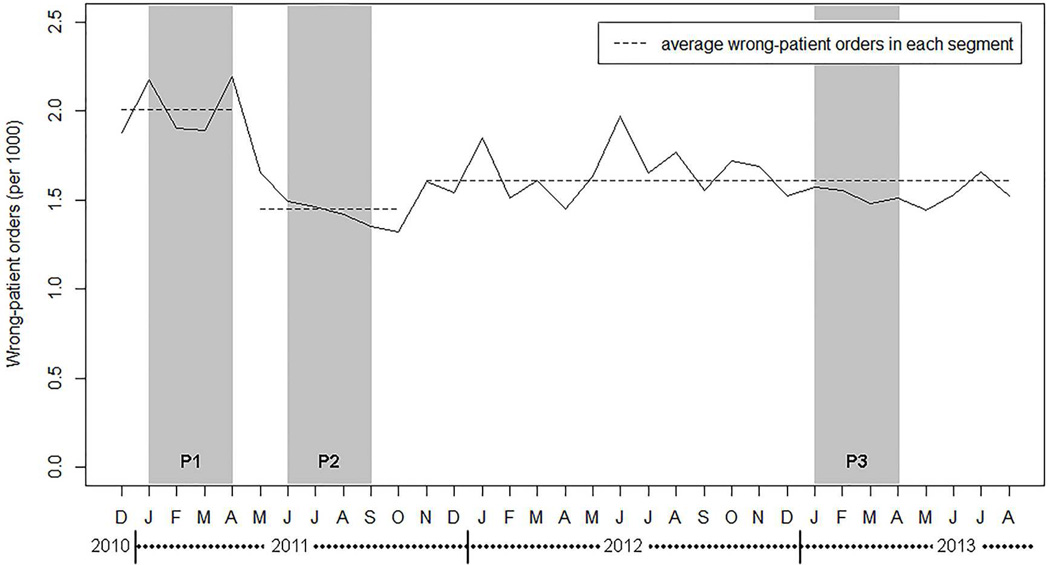
Figure 2.
The rate of wrong-patient orders in each month, per 1000 orders. Dashed lines show the average rate of wrong-patient orders in each segment detected in the data using change-point analysis17. Shaded areas show the study periods: pre-intervention (P1), short-term follow-up after intervention (P2), and long-term follow-up after intervention (P3).

