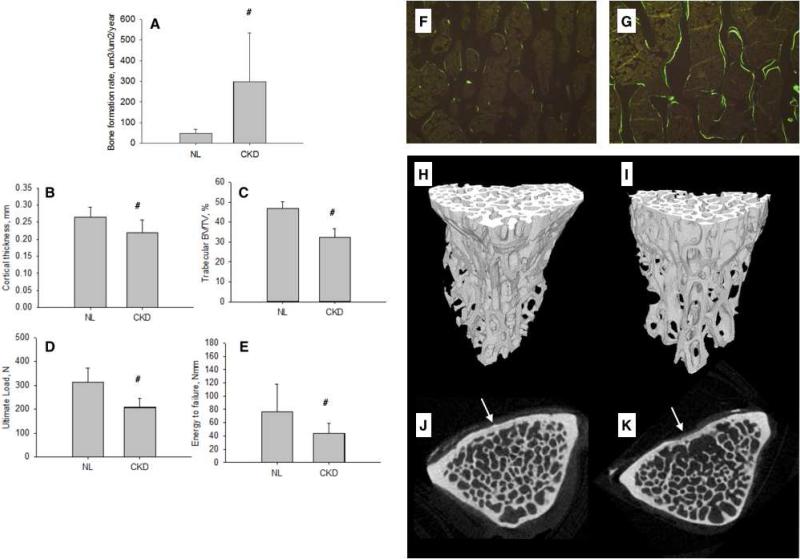
Figure 2.
Vertebral phenotype of animals with high-PTH CKD compared to normal littermates (NL). (A) Trabecular bone formation rate, (B) cortical thickness, (C) trabecular BV/TV, (D) ultimate load, and (E) energy to failure. Representative fluorochrome labeling images (taken from animal with remodeling values closest to group mean) from vertebral bone of NL (F) and CKD (G) animals. Representative 3D reconstructions (taken from the animal with BV/TV closest to the group mean) from trabecular bone in the vertebra of NL (H) and CKD (I) animals. Representative cross-sections depicting region of cortical thickness assessment (in cortex noted by arrow) of NL (J) and CKD (K).# p < 0.05 versus NL.

