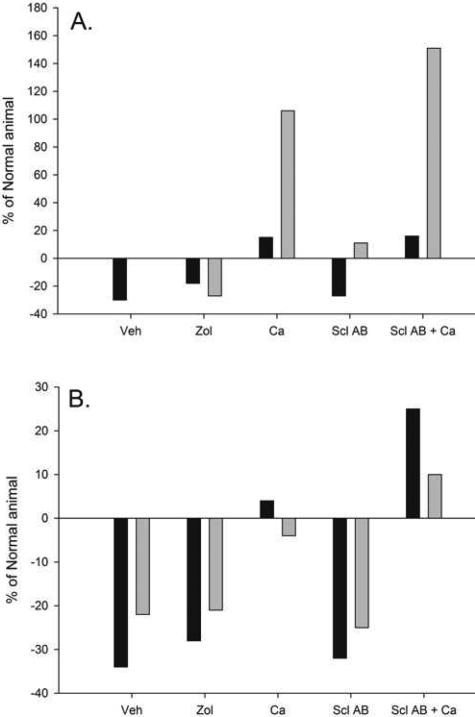
Figure 5.
Summary of vertebral and long bone response to disease and treatment response. (A) Trabecular bone volume of the vertebra (black bars) and proximal tibia (gray bars). (B) Ultimate load of the vertebra (trabecular and cortical bone together; black bars) and the femoral diaphysis (purely cortical bone; gray bars). Long bone data were pulled from previous publications in this same animal model. Data presented as percent of normal animals.

