FIG. 6.
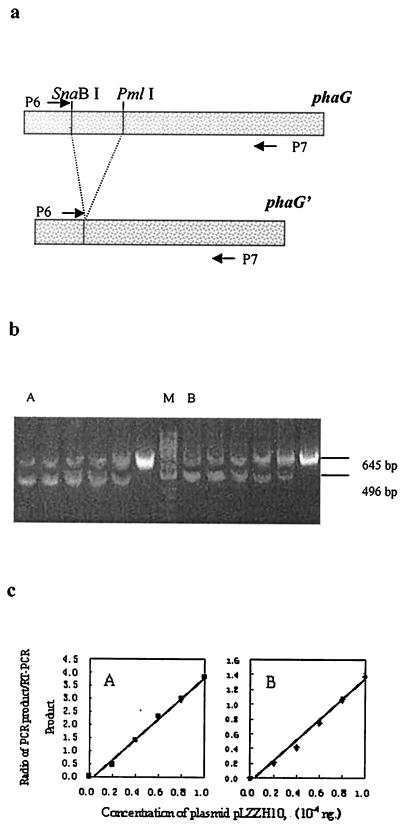
Semiquantitative RT-PCR assay of phaG transcription in the tesB-negative strain P. putida GPp104(pBBR1MCS-2) (A) and the tesB-containing strain P. putida GPp104(pLZZH09) (B). The strains were sampled from the flask cultures (described in Materials and Methods). (a) RT-PCR and PCR were performed by employing primers P6 and P7. Plasmid pLZZH10, harboring a DNA fragment, phaG′ (phaG without a central SnaBI/PmlI fragment), was used as competitive DNA. (b and c) Competitive DNA (1.0 × 10⁻⁴, 0.8 × 10⁻⁴, 0.6 × 10⁻⁴, 0.4 × 10⁻⁴, 0.2 × 10⁻⁴, and 0 ng) was added to lanes from left to right, respectively, in gels A and B. Lane M is a GeneRuler 50-bp DNA ladder (MBI). The fluorescence intensities of the bands on the agarose gel in each lane were quantified by densitometry following ethidium bromide staining. The ratio of the intensity of the PCR product (496 bp) of competitive DNA to that of the RT-PCR product (645 bp) was calculated for each reaction, and these ratios were plotted as a function of the competitive DNA concentration (c). The data are shown as means of five experiments. The error bars for SEM are not visible because they are smaller than the symbol size.

