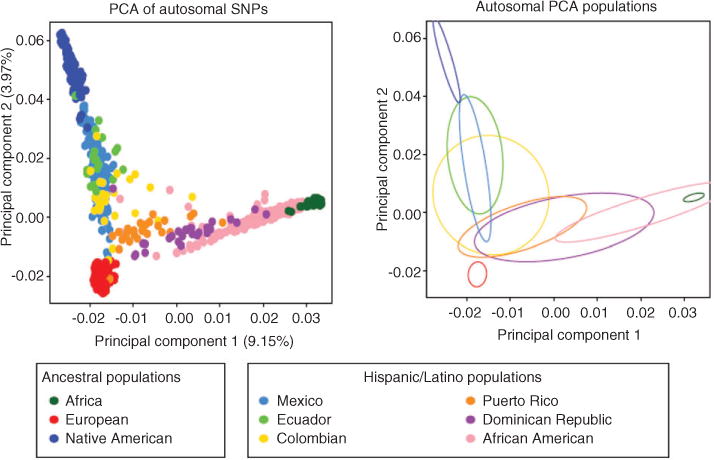
Figure 1.

Principal component analysis (PCA) results of the Hispanic individuals with Europeans, Africans and Native Americans. PC 1 vs. PC2 scatter plots based on autosomal markers (left plot). Ellipses are fitted to the PCA results on the autosomes (right plot). Reprinted from Bryc et al. [11] with permission.
