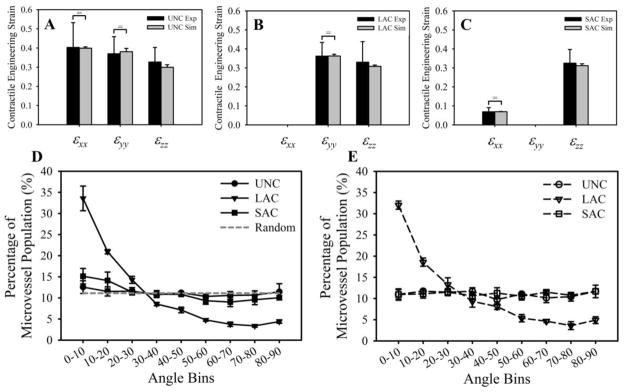
Figure 10.

Gel contraction and microvessel alignment for each of the three boundary conditions. (A–C) Engineering strain (gel contraction) was measured at the geometric center of each construct for the unconstrained (A), long-axis constrained (B), and short-axis constrained (C) constructs. Experimental measurements are shown in black, computational predictions of gel contraction are in gray. Statistical equivalence as detected by TOST-test is indicated by the bracket and equal sign. (D, E) Distributions of microvessel alignment with respect to the long-axis (x-axis) of the gel measured from the experiments (D) and predicted by the simulations (E). Microvessels in the LAC experiments were highly aligned along the long-axis, while randomly oriented in the UNC and SAC conditions. The computational simulations accurately predicted microvessel alignment in each of the three boundary conditions.
