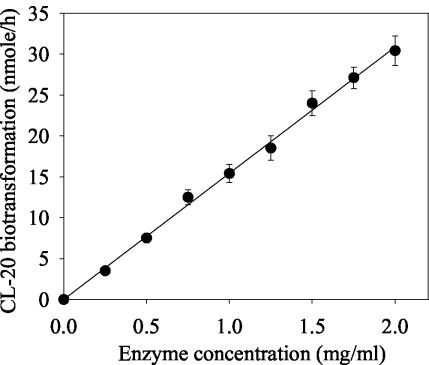
FIG. 2.
Progress curve demonstrating CL-20 biotransformation as a function of salicylate 1-monooxygenase concentration. The linear-regression curve has a gradient of 15.42 and an r2 of 0.99. Data are means of results from triplicate experiments, and error bars indicate standard errors. Some error bars are not visible due to their small size.

