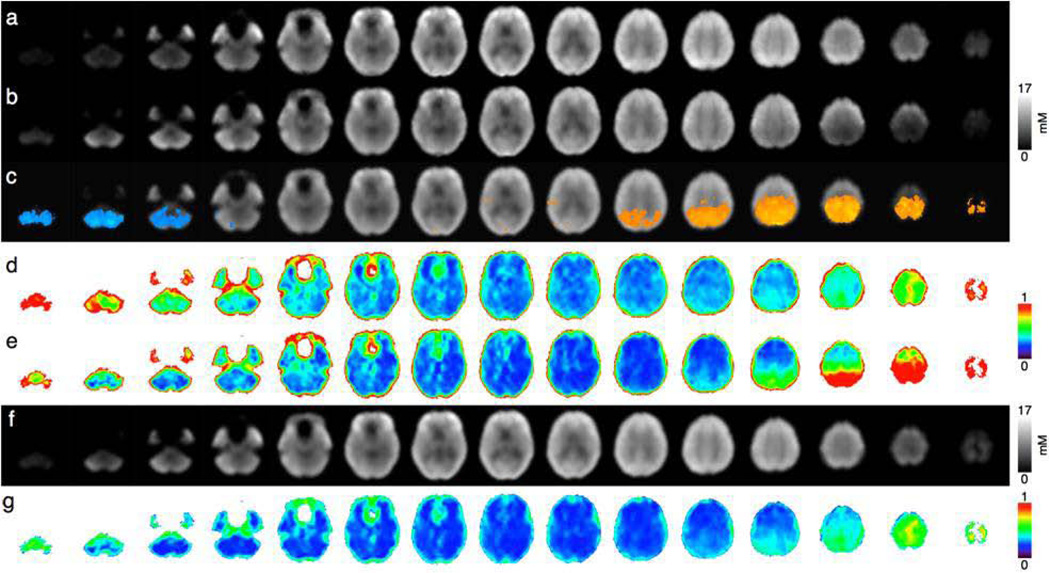
Figure 4.
Mean NAA concentration maps (Qabs) across 10 subjects for (a) AC-PC and (b) AC-PC+15°orientation lines, (c) mean maps with regions where AC-PC values are significantly higher (in orange) and lower (in blue) than AC-PC+15° values (p<0.05), nSD maps across subjects for (d) AC-PC and (e) AC-PC+15° orientations, (g) weighted NAA mean and (f) SD across subjects of weighted NAA means.

