
Figure 1.
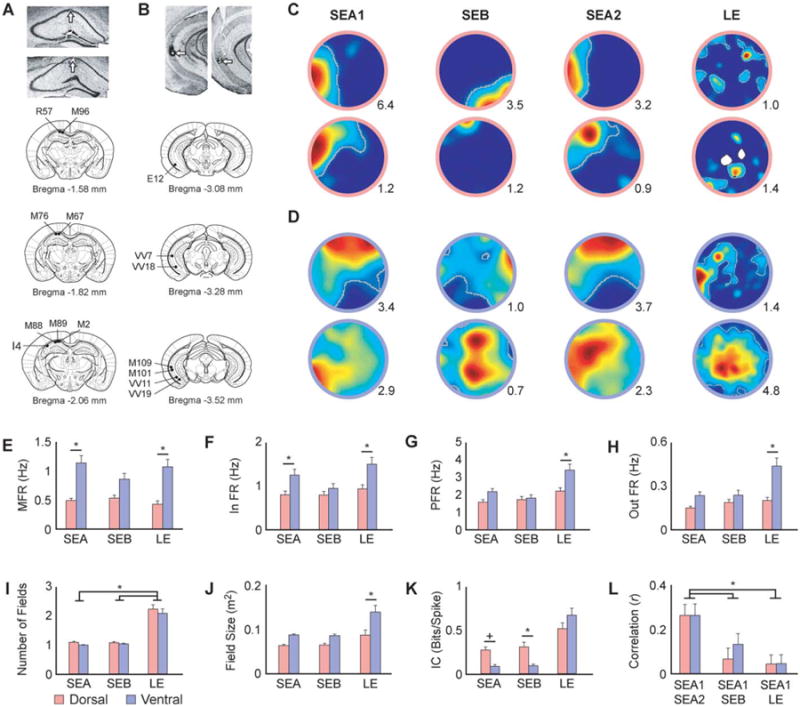
Histology and single cell visuospatial responses. A, B) Representative photomicrographs of rostrocaudal DH and VH coronal sections after Nissl staining (top panels) and coronal schematic representations showing the location of the electrodes in all animals. Tetrodes were moved in unison and lesions indicate location of the bundle. Dorsal: visuospatial: N = 6; olfactory: N = 5; three animals were run in both conditions. Ventral: visuospatial: N = 5; olfactory: N = 4; two animals were run in both conditions. C, D) Example place cell rate maps depicting the activity of dorsal (C) and ventral (D) cells during visuospatial trials. Cells in both regions remapped in the SEB and LE, but remained stable during exposures to the same environment (SEA). The peak firing rate is shown in the lower right corner of each map. Place fields are outlined in grey. E, F) Ventral cells exhibited higher mean (E) and in field (F) firing rates than dorsal cells across all visuospatial conditions (Table 1; A and B). G, H) Ventral cells did not significantly differ from dorsal cells in peak (G) or out of field (H) firing rates, except in the mildly anxiogenic LE (Table 1; C and D). I) The number of fields did not differ between regions, but more cells in both regions displayed multiple fields in the LE (Table 1; E). J) Consistent with prior work, ventral cells displayed larger fields than dorsal cells, an effect that was significant in the LE (Table 1; F). K) Ventral cells displayed lower information content than dorsal cells in the small environments, but there were no differences between the groups in the LE (Table 1; G). L) Pixel-by-pixel cross-correlations of place field maps quantifying stability across conditions. Dorsal and ventral cells showed comparable remapping across sessions. In both regions more remapping was observed when the visuospatial cues were replaced (SEB) and when the environment was expanded (LE) than when the animals were tested in the same original environment (SEA1/SEA2; Table 1; H). SEA: standard environment A, SEB: standard environment B; LE: large environment. MFR: mean firing rate, In FR: in field firing rate, PFR: peak firing rate, out FR: out of field firing rate, IC: information content. Error bars indicate +1 standard error. *Indicates significant SNK post hoc comparison at α = 0.05. +Indicates a trend toward significance (P between 0.05 and 0.09).