
Figure 2.
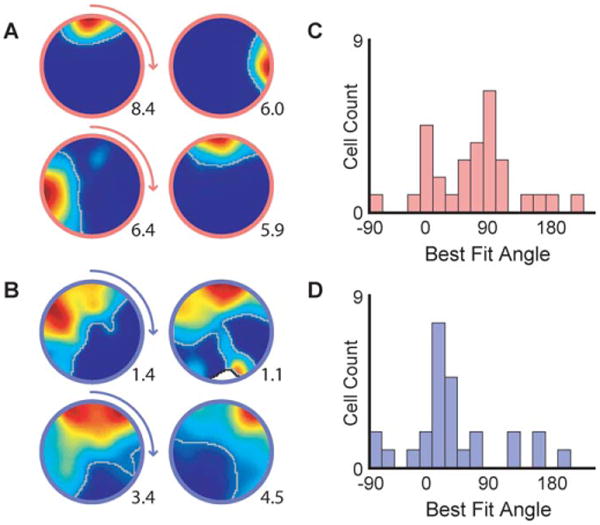
Cue rotations. A, B) Example place field maps for dorsal (A) and ventral (B) cells when the local visual cues are rotated. C, D) Histograms of best-fit rotation angles for C) dorsal and D) ventral cells. The majority of dorsal cells displayed rotations of the fields that were tightly coupled to the cue rotations. However, ventral rotations systematically fell between the original and the rotated position of the cues (Watson-Williams circular test: F(1,56) = 5.12, P = 0.03). The peak firing rate is shown in the lower right corner of each map. Place fields are outlined in grey.