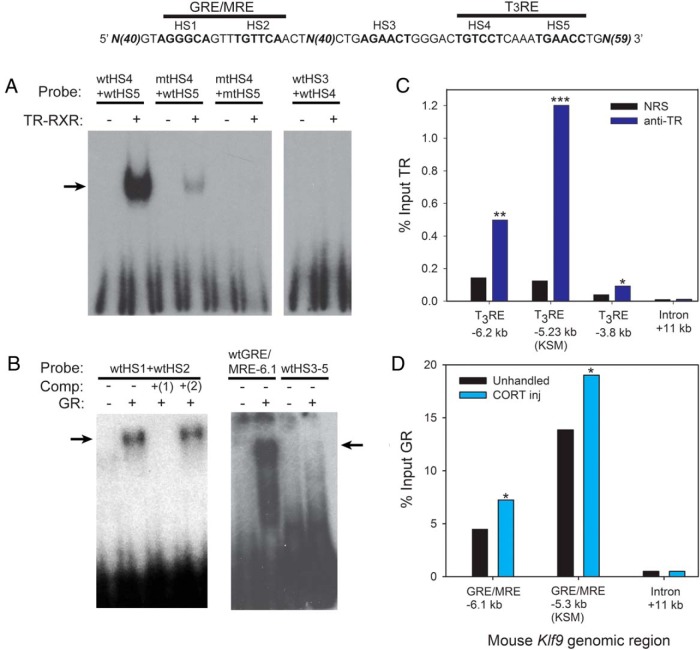
Figure 4.
TR and GR bind in vitro to predicted hormone response elements and associate in chromatin with Klf9 upstream regions in mouse hippocampus. A, EMSA for TR-RXR binding to [32P]-labeled oligonucleotide probes (Supplemental Table 2) corresponding to wild-type (wt) or mutated (mt) hormone response elements located upstream of the mouse Klf9 gene (shown above the graphs). Probes were incubated with or without in vitro synthesized TRβ plus RXRα before electrophoresis. The arrow indicates supershifted bands due to TR-RXR binding to the radiolabeled probes. The TR-RXR showed strong binding to the wtHS4 + wtHS5 probe (HS, within the KSM shown in the diagram above the graphs), which corresponds to the predicted DR+4 T3RE located within the KSM, but not to other probes. B, Competitive EMSA for GR binding to [32P]-labeled oligonucleotide probes (Supplemental Table 2) corresponding to wt hormone response elements located at the mouse KSM (at −5.3 kb upstream of the TSS) and the GRE/MRE located upstream of the KSM (at −6.1 kb upstream of the TSS; identified by Bagamasbad et al [18]). Probes were incubated with or without in vitro synthesized GR before electrophoresis. In lanes 3 and 4, the reactions were incubated with 1.5μM radioinert competitor: 1) wtHS1 + wtHS2; 2) mtHS1 + mtHS2. The arrows indicate supershifted bands due to GR binding to the radiolabeled probes. The GR bound to the GRE/MRE-5.3 kb and GRE/MRE-6.1 kb probes but not to the wtHS3–5 probe; GR binding to the GRE/MRE-5.3 kb probe was competed by wt but not by mutant radioinert oligonucleotide. C, TR association at the Klf9 locus in mouse hippocampus analyzed by ChIP assay. We administered ip injections of vehicle or T3 (25 μg/kg BW; n = 4–5/treatment) to wt PND5 mice and dissected the hippocampal region 4 hours later for chromatin extraction for TR ChIP assay. We analyzed ChIP DNA by RT-qPCR using TaqMan assays that targeted the region of the predicted T3RE at −6.2 kb from the Klf9 TSS, the T3RE within the KSM (−5.23 kb) and a distal intronic region (+11 kb; negative control region) of the mouse Klf9 gene. Bars represent the mean ChIP signal expressed as a percentage of input for TR serum (anti-TR) or NRS (negative control). The asterisks indicate statistically significant differences between the anti-TR and NRS groups (*, P < .05; **, P < .01; ***, P < .001; Student's 2 sample t test; derived values were log10 transformed before statistical analysis). D, GR association at the Klf9 locus in mouse hippocampus analyzed by ChIP assay. wtPND6 mice were left unhandled or given ip injections of CORT (14 mg/kg BW; n = 9/treatment). One hour after injection, animals were killed, the hippocampal region was dissected, and chromatin was extracted for GR ChIP assay. The ChIP DNA was analyzed by RT-qPCR using TaqMan assays that targeted the GRE/MRE −6.1 kb, the GRE/MRE at −5.3 kb within the KSM, and a distal intronic region (+11 kb; negative control region) of the mouse Klf9 gene. Bars represent the mean ChIP signal expressed as a percentage of input. Asterisks indicate statistically significant differences between unhandled and CORT-injected animals (P < .05; Student's 2 sample t test; derived values were log10 transformed before statistical analysis).

