Figure 7.
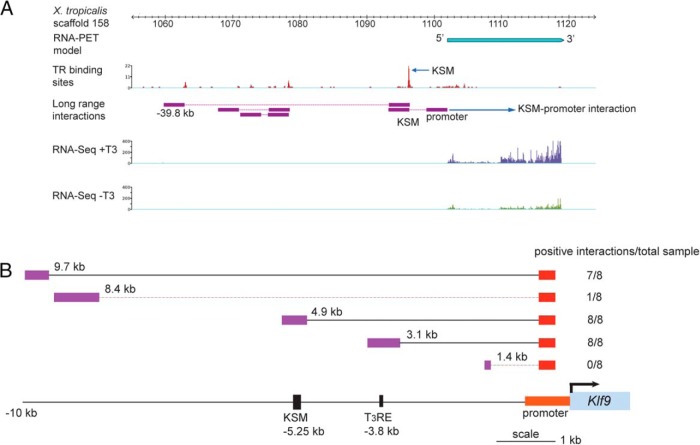
Chromosome looping brings the KSM into contact with the Klf9 promoter. A, ChIA-PET shows that the frog KSM interacts with the Klf9 promoter and a far upstream region (located at −39.8 kb upstream of the Klf9 TSS). Chromatin from X. tropicalis tadpole tail fin epidermis (after a 24-h treatment with 10nM T3 in vivo) was processed for TR ChIP, then ChIA-PET was conducted. Data for RNA-PET sequencing (103) and RNA sequencing (RNA-seq) (separate experiments conducted on tadpole tail fin harvested from tadpoles treated without or with 10nM T3 for 24 h) at the frog Klf9 locus are shown to identify the Klf9 transcribed region and the TSS. The TR binding sites and the corresponding levels of TR bound across the Klf9 locus, indicated as red peaks, were identified by the TR ChIP-seq component of the ChIA-PET dataset. Within the genomic region shown, the highest level of TR binding was seen at a region corresponding to the KSM (arrow). Long-range chromosomal interactions across the frog Klf9 locus were identified by ChIA-PET and are indicated by the purple boxes connected by red lines. Note the interaction between the KSM and promoter, and the KSM and a far upstream region. B, 3C-qPCR analysis conducted on chromatin isolated from mouse HT-22 cells treated with vehicle or T3 (30nM) plus CORT (100nM) for 4 hours. Primer sets that covered 5 locations upstream of the mouse Klf9 locus were used, shown as distances in kilobases between the anchoring point within the promoter and the upstream region analyzed. The genomic locations of the KSM and the −3.8-kb T3RE relative to the TSS are shown in the schematic at the bottom. The number of positive interactions detected for each genomic location is given in the column to the right; that is, the number of samples that showed qPCR amplification using the constant reverse primer and TaqMan probe, and the different forward primers (n = 8; 4 vehicle and 4 hormone-treated samples; there was no effect of hormone treatment on the interaction) (Supplemental Materials and Methods and Supplemental Table 3). Solid lines indicate significant interactions, dashed lines no significant interactions.

