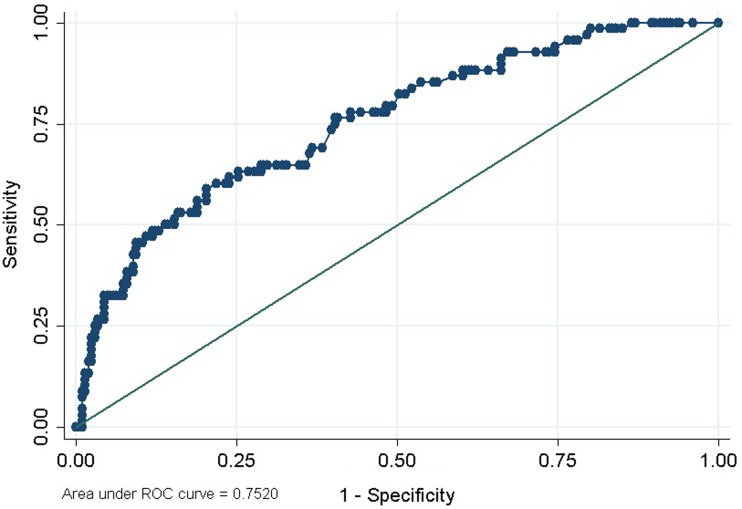
Fig. 1.
Receiver operating characteristic curve of a threshold DASH score as an estimated diagnosis of clinical depression. For an estimated diagnosis of major depression based on one of two questionnaires, the rate of false positives is plotted on the x-axis and the rate of true positives on the y-axis for a range of threshold values of QuickDASH/DASH scores. The area under the curve of 0.75 indicates acceptable discrimination. A DASH score of 0.55 had the highest positive predictive value and was selected as the threshold

