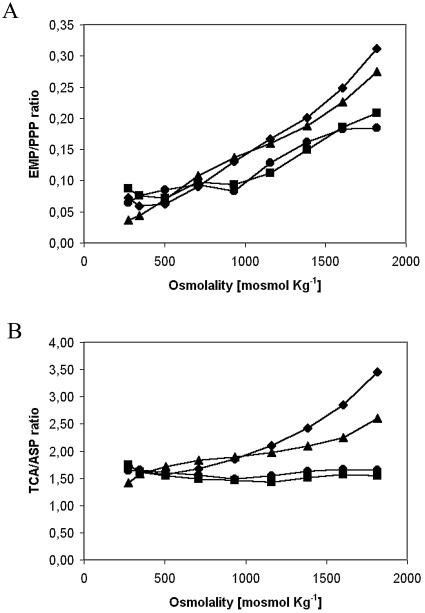
FIG. 3.
Effect of rises in medium osmolality on the ratios between the main exit branches of the principal nodes at different dilution rates. (A) Glycolysis (EMP)/pentose phosphate pathway (PPP) ratio (G6P node). (B) Tricarboxylic acid cycle (TCA)/aspartate synthesis (ASP) ratio (OAA node). The graphs show data for 0.09 h−1 (circles), 0.13 h−1 (squares), 0.17 h−1 (triangles), and 0.21 h−1 (diamonds).

