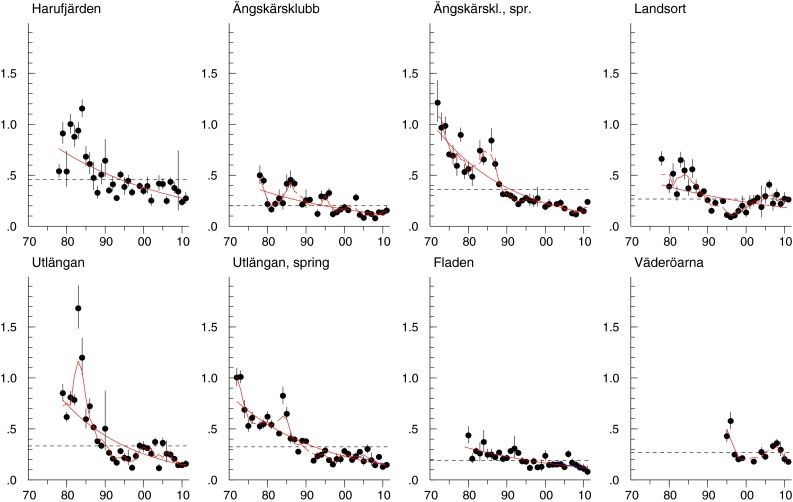
Fig. 4.

DDT/DDE ratios in herring muscle from Harufjärden, Ängskärsklubb (autumn and spring), Landsort, Utlängan (autumn and spring), Fladen, and Väderöarna. The red lines show a significant (p < 0.05) trend over the whole period. The red smooth lines show non-linear trends (p < 0.05). The black dotted horizontal line shows the geometric mean concentration over the whole period. Each figure displays the geometric mean concentration for each year (circles) and the 95 % CI of the geometric means
