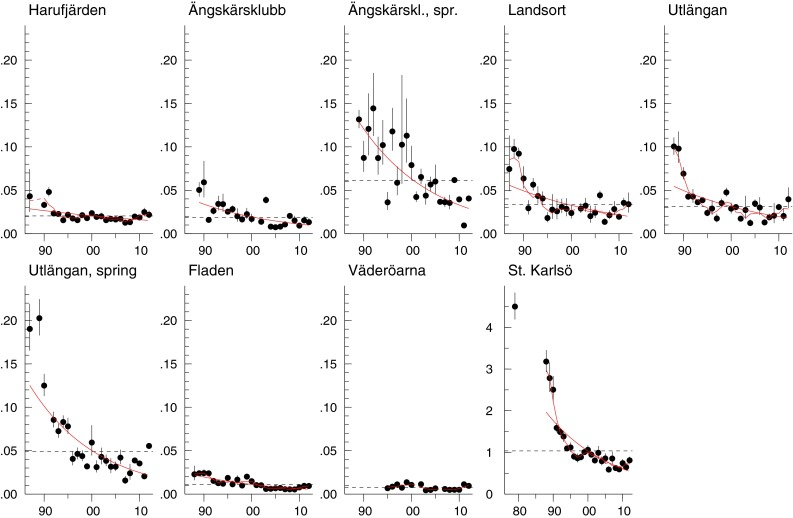
Fig. 6.

HCB concentrations (µg g−1 lipid weight) in herring muscle from Harufjärden, Ängskärsklubb (autumn and spring), Landsort, Utlängan (autumn and spring), Fladen, and Väderöarna, and guillemot egg from Stora (St) Karlsö. The linear red lines show significant trends over the whole period and the linear blue lines significant trends for the last 10 years (p < 0.05). The red smooth lines show non-linear trends (p < 0.05). The black dotted horizontal line shows the geometric mean concentration over the whole period. Each figure displays the geometric mean concentration of each year (circles) and the 95 % CI of the geometric means. The bars represent years where all values were below LOQ
