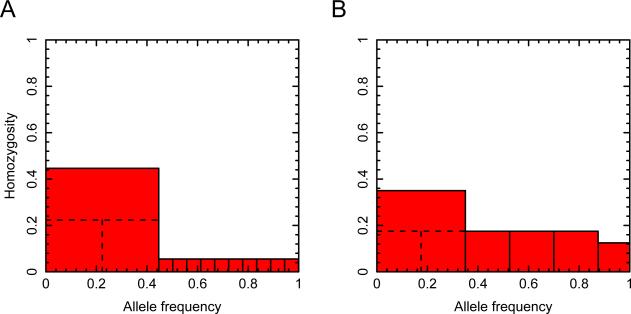
Figure 1.
A geometric illustration of the argument for finding the upper bound on H2/H1 as a function of H12. In both panels, the unit interval (x-axis) is partitioned into components representing allele frequencies. H12 is represented by the sum of the areas of the red shaded regions, each indicating a squared frequency; the largest red square indicates (p1 + p2)2 or M2. (A) Step 1: for fixed H12 and fixed M, H2/H1 is maximal when p2 = p1. The maximal H2/H1 requires p1 to be as small as possible, but p1 ≥ p2 by definition; at the maximal H2/H1, p1 and p2 are equal. (B) Step 2: allowing M to vary while keeping H12 fixed, H2/H1 is maximal when M is as small as possible. At the maximum for H2/H1, M is reduced to the point where p1 and as many subsequent alleles as possible have identical frequency, and at most one remaining allele of smaller frequency completes the unit interval. In both panels, H12=0.23. Part A uses for M and for each of 10 additional alleles. The dashed lines illustrate the choice of p2 = p1 = M/2. Part B achieves the maximum of H2/H1 = 221/270 ≈ 0.8185 (eq. 12), with M = 0.35.

