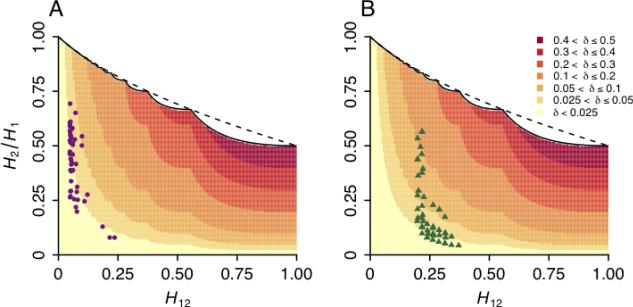
Figure 3.
The effect of the application of Z′ on H2/H1 values in data from Drosophila. The shaded regions show the change δ in H2/H1 values after applying the normalization, where δ = Z′ – Z. Overlaid are points representing the top 50 windows for H12 in Drosophila melanogaster genome scans. (A) Drosophila Genetic Reference Panel (DGRP) data. (B) Drosophila Population Genomic Panel (DPGP) data. The solid line shows the exact upper bound on H2/H1 (eq. 12), and the dashed line shows the approximate upper bound (eq. 15).

