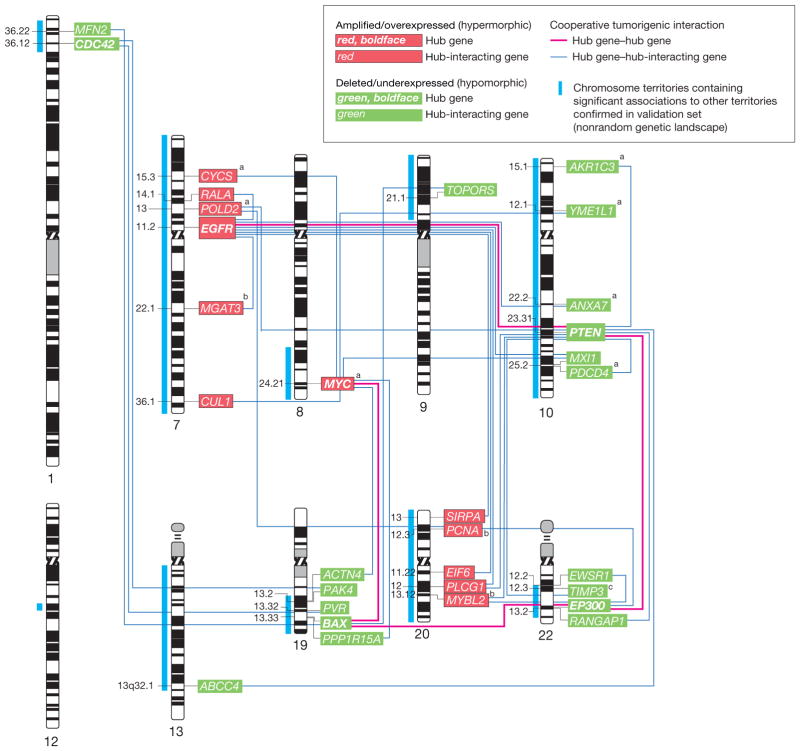
Figure 5.
Networking of 31 Hub and Hub-Interacting Genes With Cooperatively Tumorigenic Relationships That Map to the TCGA Validated Landscape
Human chromosome ideogram representation of the networking of 31 hub and hub-interacting genes that map to The Cancer Genome Atlas Pilot Project (TCGA)–validated genetic landscape and possess cooperatively tumorigenic relationships. These cooperatively tumorigenic relationships emerge through the mode of interaction between the genes and their significant coalteration. Gene dosage–gene expression integration for 30 of the 31 genes with combined availability of gene dosage and expression data in TCGA confirmed significant gene dosage effects on transcription for 27 (90.0%) of 30 genes (Benjamini-Hochberg false-discovery rate–corrected P<.05). Labels indicate the cytogenetic band mapping of the genes.
aGenes with a significant (P<.05) relationship between gene dosage and duration of patient survival in the TCGA data set based on Cox proportional hazards regression analysis.
bGenes without confirmed significant gene dosage–gene expression relationship in the TCGA data set.
cTIMP3 is embedded within an intron of the SYN3 gene. Gene dosage information for TIMP3 was only indirectly available through a probe mapping to SYN3 in TCGA. Integration of gene dosage information using this probe and TIMP3 transcript information revealed a significant (P<.05) gene dosage–transcript relationship.

